
Europe’s Geopolitical Trade Power Play, A Stress Test for Regional Jobs
EU–Mercosur may read like a technical trade deal, but it really tests whether Europe’s regions have the readiness to turn new competition into upgrading rather than local job anxiety.
Ελληνική μετάφραση
Η γεωπολιτική εμπορική κίνηση της Ευρώπης, ένα τεστ αντοχής για τις περιφερειακές θέσεις εργασίας
Η συμφωνία ΕΕ–Mercosur διαβάζεται συχνά ως τεχνική εμπορική συμφωνία, και στην πράξη δοκιμάζει αν οι ευρωπαϊκές περιφέρειες έχουν την ετοιμότητα να μετατρέψουν τον νέο ανταγωνισμό σε αναβάθμιση, και όχι σε ανασφάλεια για τις τοπικές δουλειές.
Ίδια συμφωνία, ριζικά διαφορετικές εκβάσεις, γιατί η ετοιμότητα αποφασίζει πώς “προσγειώνεται” ο ανταγωνισμός.
Στο Europe’s Hollowing-Out Moment, αναλύσαμε πώς η ευρωπαϊκή ευαλωτότητα αυξάνεται όταν η υλική επάρκεια (σε στρατιωτικό εξοπλισμό), ο βιομηχανικός ρυθμός αναπλήρωσης (στρατιωτικού εξοπλισμού) και η ασφάλεια συμμαχιών παύουν να ακολουθούν τα σοκ του περιβάλλοντος, και αυτή η ασυμφωνία σπρώχνει την ευρωπαϊκή στρατηγική προς εργαλεία που “κλιμακώνουν” γρήγορα, με την πρόσβαση στην αγορά να παραμένει η πιο άμεσα αναπτύξιμη μορφή ισχύος της ΕΕ.
Η συμφωνία ΕΕ–Mercosur ταιριάζει σε αυτό το μοτίβο, με την Ευρώπη να αξιοποιεί μια εμπορική συμφωνία ως γεωπολιτική κίνηση, επειδή αναδιαμορφώνει σχέσεις, πρότυπα και διαδρομές εφοδιασμού σε μια μεγάλη περιοχή, και το κάνει μέσω της Ενιαίας Αγοράς, και όχι μέσω σκληρής ισχύος.
Η συμφωνία διαπραγματεύεται από το 1999 και πολιτικά “επανενεργοποιήθηκε” για υπογραφή τον Ιανουάριο 2026, ενώ η μοντελοποίηση που ανέθεσε η Επιτροπή προβλέπει κέρδη ευημερίας για την ΕΕ €6,3–€8,6 δισ. (σε ευρώ 2011) έως το 2032, με την πίεση να συγκεντρώνεται σε πολιτικά ευαίσθητους αγροτικούς κλάδους όπως το βόειο/πρόβειο κρέας και η ζάχαρη. (Council press release; Reuters; SIA (LSE) — welfare & sector outputs).
Αυτός ο συνδυασμός, ένα τέταρτο του αιώνα διαπραγμάτευσης για μονοψήφια δισ. συνολικής ευημερίας και ταυτόχρονα συμπυκνωμένη τοπική έκθεση, οδηγεί σε μια ανάγνωση της συμφωνίας ως γεωπολιτικής μέσω πρόσβασης στην αγορά, και τη μετατρέπει σε τεστ αντοχής για τις περιφερειακές θέσεις εργασίας.
Αυτό ισοδυναμεί με €14–€19 όφελος ανά κάτοικο της ΕΕ.
TL;DR (1 λεπτό) ⚡
- Τι συνέβη: Τα κράτη-μέλη της ΕΕ ενέκριναν αυτή την εβδομάδα το “πράσινο φως” για υπογραφή, με ρεπορτάζ να δείχνουν τελετή υπογραφής στις 17 Ιανουαρίου 2026 στην Παραγουάη, ενώ παραμένει αναγκαία η συναίνεση του Ευρωπαϊκού Κοινοβουλίου πριν η ενδιάμεση εμπορική συμφωνία τεθεί πλήρως σε ισχύ. (Reuters — approval; Reuters — signing timeline; European Commission — process notes / text).
- Τι λένε τα οικονομικά: Η μοντελοποίηση που ανέθεσε η Επιτροπή προβλέπει επίδραση στο ΑΕΠ της ΕΕ περίπου +0,1% έως το 2032 έναντι του baseline, με κέρδη ευημερίας €6,3–€8,6 δισ. (σε ευρώ 2011), και τις πτώσεις παραγωγής να συγκεντρώνονται πιο καθαρά στο βόειο/πρόβειο κρέας και στη ζάχαρη στο συντηρητικό σενάριο. (SIA (LSE) — Final Report). Αυτό αντιστοιχεί σε €14–€19 ανά κάτοικο της ΕΕ, με βάση πληθυσμό 450,4 εκατ. την 1η Ιανουαρίου 2025 (Eurostat).
- Πού είναι το πολιτικό ρήγμα: Η “έτοιμη Ευρώπη” τείνει να μετατρέπει την πίεση τιμών σε αναβάθμιση και ανακατανομή, και η “ανέτοιμη Ευρώπη” τείνει να τη βιώνει ως συμπίεση περιθωρίων και κίνδυνο αγροτικής αντίδρασης.
Η ΕΕ–Mercosur λειτουργεί ως τεστ αντοχής της εσωτερικής οικονομικής γεωγραφίας της Ευρώπης, με το ίδιο άνοιγμα να παράγει μετάβαση σε κάποιους τόπους και πολιτική εκτόπισης σε άλλους.
Γιατί αυτή η συμφωνία είναι γεωπολιτική 🔭
Η εμπορική πολιτική της Ευρώπης αποκτά ολοένα και περισσότερο γεωπολιτικό βάρος, επειδή η πρόσβαση στην Ενιαία Αγορά είναι μοχλός που κινείται ταχύτερα από την ανασύνταξη της βιομηχανίας. Η αξία αυτού του μοχλού αυξάνεται όταν το διεθνές σύστημα επιβραβεύει τη συγκρότηση μπλοκ, την ευθυγράμμιση προτύπων και τους ανθεκτικούς διαδρόμους εφοδιασμού.
Τέσσερις τρόποι με τους οποίους το “power play” εμφανίζεται στην πράξη:
- Διαμόρφωση του χάρτη εταίρων: η συμφωνία εμβαθύνει τη στρατηγική παρουσία της Ευρώπης στη Λατινική Αμερική μέσω κανόνων, προτύπων και προτιμησιακής πρόσβασης, και αυτό το πλαίσιο εμφανίζεται έντονα στην τρέχουσα κάλυψη και πολιτική συζήτηση. (Financial Times — coverage; The Guardian — coverage)
- Εξαγωγή κανόνων και προτύπων: οι εμπορικές συμφωνίες επεκτείνουν την κανονιστική “περίμετρο” της ΕΕ μέσω απαιτήσεων συμμόρφωσης, προτύπων ιχνηλασιμότητας και όρων εισόδου στην αγορά, και αυτοί οι μηχανισμοί είναι εξίσου κρίσιμοι με τους δασμούς για τη μακροχρόνια ευθυγράμμιση. (European Commission — agreement text & process notes)
- Λογική ασφάλειας εφοδιασμού: η συμφωνία κινείται στον ίδιο στρατηγικό χώρο με τις ανησυχίες ανθεκτικότητας, επειδή η διαφοροποίηση και η αξιοπιστία μετρούν όλο και περισσότερο στο σύνολο του εμπορικού χαρτοφυλακίου, ειδικά όταν τα σοκ αλληλεπιδρούν. (JRC — cumulative impact framing)
- Περιορισμός εσωτερικής συνοχής: το γεωπολιτικό “upside” της συμφωνίας περνά μέσα από την τοπική ικανότητα προσαρμογής, επειδή η κλαδική συγκέντρωση τροφοδοτεί κίνδυνο νομιμοποίησης και διαμορφώνει την κοινοβουλευτική πολιτική. (SIA — distributional results; JRC — vulnerable sectors lens)
Αριθμοί με μια ματιά
Μακρο-επίδραση στην ΕΕ (μοντελοποίηση CGE) — SIA — πίνακες αποτελεσμάτων
| Μετρική | Συντηρητικό σενάριο | Φιλόδοξο σενάριο |
|---|---|---|
| Επίδραση στο ΑΕΠ της ΕΕ | +0,1% (≈ €10,9 δισ.) | +0,1% (≈ €15,0 δισ.) |
| Κέρδος ευημερίας της ΕΕ | €6,3 δισ. | €8,6 δισ. |
“Αποσβεστήρες κραδασμών” πρόσβασης στην αγορά (TRQs, σταδιακή εφαρμογή, δασμολογική μεταχείριση) — Commission agriculture factsheet
| Προϊόν | Σχεδιασμός ποσόστωσης | Κλίμακα (όπως στο factsheet) |
|---|---|---|
| Βόειο κρέας | 99.000 τόνοι TRQ, δασμός 7,5% | ≈ 1,5% της παραγωγής της ΕΕ |
| Πουλερικά | 180.000 τόνοι duty-free TRQ, σταδιακά σε 5 χρόνια | ≈ 1,3% της παραγωγής της ΕΕ |
| Ρύζι | 60.000 τόνοι duty-free TRQ, σταδιακά σε 5 χρόνια | ≈ 1,4% της κατανάλωσης της ΕΕ |
| Ζάχαρη | 180.000 τόνοι ακατέργαστη ζάχαρη ζαχαροκάλαμου για διύλιση (υφιστάμενη ποσόστωση ΠΟΕ) + 10.000 τόνοι για Παραγουάη | Πλαίσιο του factsheet |
| Αιθανόλη | 450.000 τόνοι duty-free (χημική) + 200.000 τόνοι με το 1/3 του δασμού (άλλες χρήσεις), σταδιακά σε 5 χρόνια | Πλαίσιο του factsheet |
Μεταβολές παραγωγής ανά κλάδο (ΕΕ-28, συντηρητικό σενάριο) — SIA — sector outputs
| Κλάδος (SIA) | Μοντελοποιημένη μεταβολή παραγωγής |
|---|---|
| Βόειο & πρόβειο κρέας | −0,7% |
| Ζάχαρη | −0,7% |
| Ρύζι | −0,4% |
| Πουλερικά, χοιρινό | −0,2% |
1️⃣ Τι ξεκαθαρίστηκε αυτή την εβδομάδα, και τι ακολουθεί
Τα κράτη-μέλη της ΕΕ έδωσαν το πράσινο φως για υπογραφή στις 9 Ιανουαρίου 2026, και αυτή η απόφαση μετέφερε τη συμφωνία από τη μακρά διαπραγμάτευση στο σύντομο πολιτικό timing. (Reuters — έγκριση ; Financial Times — κάλυψη ; The Guardian — κάλυψη).
Η συναίνεση του Ευρωπαϊκού Κοινοβουλίου παραμένει αναγκαία πύλη ώστε η ενδιάμεση Εμπορική Συμφωνία να τεθεί πλήρως σε ισχύ, και αυτό το θεσμικό βήμα θα συμπυκνώσει lobbying και αριθμητική συμμαχιών. (European Commission — διαδικασία / κείμενο).
Ρεπορτάζ δείχνουν τελετή υπογραφής στις 17 Ιανουαρίου 2026 στην Παραγουάη, και η στιγμή της υπογραφής τείνει να συμπιέζει τις εγχώριες αφηγήσεις σε μια απλή επιλογή, άνοιγμα με αντισταθμίσεις, ή αντίσταση με σημεία βέτο. (Reuters — χρονοδιάγραμμα υπογραφής).
2️⃣ Γιατί μικροί μέσοι όροι σε επίπεδο ΕΕ παράγουν πολιτική υψηλής έντασης
Η μακρο-επίδραση παραμένει μικρή, επειδή η ΕΕ είναι μεγάλη, διαφοροποιημένη οικονομία, και τα οριακά κέρδη αποτελεσματικότητας παραμένουν μικρά σε ποσοστιαίους όρους. Η SIA αναφέρει ΑΕΠ ΕΕ περίπου +0,1% έως το 2032 έναντι baseline, και κέρδη ευημερίας €6,3 δισ. (συντηρητικό) και €8,6 δισ. (φιλόδοξο), σε ευρώ 2011. (SIA — αποτελέσματα CGE).
Η κατανομή καθορίζει τη “θερμοκρασία” της πολιτικής, επειδή οι κλαδικές επιπτώσεις συσσωματώνονται, και οι συσσωματώσεις χαρτογραφούνται σε πραγματικούς τόπους. Στο συντηρητικό σενάριο της SIA, οι μειώσεις παραγωγής συγκεντρώνονται σε βόειο και πρόβειο κρέας (−0,7%) και ζάχαρη (−0,7%), με μικρότερες μειώσεις στο ρύζι (−0,4%) και στα πουλερικά και το χοιρινό (−0,2%). (SIA — κλαδικές μεταβολές παραγωγής).
Η Ευρώπη συζητά το εμπόριο μέσα από μέσους όρους της ΕΕ, και η Ευρώπη ψηφίζει για το εμπόριο μέσα από πραγματικότητες τοπικής προσαρμογής. Αυτή η διαφορά μετατρέπει μια “στρογγυλοποίηση” σε επίπεδο ΕΕ σε ερώτημα περιφερειακών θέσεων εργασίας.
3️⃣ Το πραγματικό ρήγμα: Έτοιμη Ευρώπη vs Ανέτοιμη Ευρώπη
Η ετοιμότητα περιγράφει την ικανότητα μιας χώρας να απορροφά πίεση τιμών και να συνεχίζει να προσφέρει σταθερά εισοδήματα, και προβλέπει αν ο ανταγωνισμός γίνεται αναβάθμιση ή παράπονο. Συνδυάζει παραγωγικότητα, διαπραγματευτική ισχύ, ικανότητα συμμόρφωσης και ταχύτητα προσαρμογής, και αυτές οι ικανότητες αποφασίζουν πόσο γρήγορα ένας κλάδος μπορεί να μετακινηθεί από ανταγωνισμό όγκου σε ανταγωνισμό αξίας.
Μια λίστα ετοιμότητας που προβλέπει πολιτικά αποτελέσματα ✅
- Παραγωγικότητα και θέση κόστους, συμπεριλαμβανομένης της ανθεκτικότητας των εισροών και της έκθεσης στην ενέργεια.
- Συνεταιρισμοί και διαπραγματευτική ισχύς, συμπεριλαμβανομένου του τρόπου με τον οποίο διαπραγματεύονται τα περιθώρια σε όλη την αλυσίδα αξίας.
- Ικανότητα logistics, συμπεριλαμβανομένων αποθήκευσης, ψυχρής αλυσίδας και μεταφορών που προστατεύουν την αξία.
- Throughput συμμόρφωσης, συμπεριλαμβανομένων ιχνηλασιμότητας, ελέγχων και επιθεωρήσεων που μετατρέπουν τα πρότυπα σε ρουτίνα.
- Ταχύτητα προσαρμογής, συμπεριλαμβανομένης της δυνατότητας αλλαγής μείγματος προϊόντων, ανόδου στην αλυσίδα αξίας, ή εξόδου με στήριξη.
Ο εσωτερικός χάρτης της Ευρώπης οδηγεί το αποτέλεσμα, επειδή τα “buffers” διαφέρουν από περιοχή σε περιοχή. Μια συνθήκη που μοιάζει οριακή σε έναν τόπο μπορεί να μοιάζει υπαρξιακή σε έναν άλλον.
4️⃣ Ο χάρτης πίσω από την πολιτική, γιατί η ίδια συμφωνία “προσγειώνεται” διαφορετικά
[Εικόνα στο πρωτότυπο]
Η ΕΕ–Mercosur γίνεται ορατή μέσα από τις ευρωπαϊκές περιφέρειες. Η συμφωνία αλλάζει περιθώρια και ευκαιρίες μέσα σε συγκεκριμένους τοπικούς κλάδους, και αυτά τα τοπικά συστήματα αποφασίζουν αν ο ανταγωνισμός μεταφράζεται σε αναβάθμιση ή σε αντίδραση. Η πίεση τιμών, η πρόσβαση στην αγορά και το κόστος προσαρμογής “πέφτουν” πάνω στα περιφερειακά παραγωγικά συστήματα της Ευρώπης, και αυτά διαφέρουν έντονα ως προς τους αποσβεστήρες, τον συντονισμό και την ταχύτητα.
Αυτό εξηγεί γιατί η ίδια συνθήκη μπορεί να μοιάζει με σταδιακή μετάβαση σε ένα τμήμα της Ένωσης, και με σοκ νομιμοποίησης σε ένα άλλο.
Για να γίνει αυτός ο μηχανισμός αναγνώσιμος, μπορούμε να τοποθετήσουμε τις χώρες σε ένα απλό (ενδεικτικό) 2×2 matrix. (Τα αναλυτικά στοιχεία ανά χώρα και τα readiness gaps βρίσκονται στα research toggles στο τέλος της ενότητας 4. Η τοποθέτηση αντικατοπτρίζει την τεκμηρίωση στο Research Toggle A (κατανομή) και στο Toggle B (κενά ετοιμότητας), με τους κανόνες banding που περιγράφονται εδώ. Τα Toggles C–D περιλαμβάνουν τις τελικές κατατάξεις χωρών, τις τιμές και τους αριθμητικούς κανόνες.)
Άξονας 1 — Ετοιμότητα να απορροφήσει τον ανταγωνισμό (Χαμηλή / Μεσαία / Υψηλή)
Χρησιμοποιούμε τρία παρατηρήσιμα “σήματα” που επανέρχονται συστηματικά στη σχετική συζήτηση:
- Αποδοτικότητα και δομή παραγωγής (παραγωγικότητα, μηχανοποίηση, κλίμακα)
- Συντονισμός αλυσίδας αξίας (συνεταιρισμοί, μεταποίηση, logistics)
- Ικανότητα εκτέλεσης (αξιοπιστία εφαρμογής/ελέγχων της ΚΑΠ, δυνατότητα να μεταφράζονται οι πόροι σε εκσυγχρονισμό)
Κανόνας απόφασης:
- Υψηλή ετοιμότητα = 2–3 σήματα ξεκάθαρα ισχυρά
- Μεσαία = μικτό προφίλ σημάτων
- Χαμηλή = 2–3 σήματα ξεκάθαρα αδύναμα / “ανέτοιμα”
Άξονας 2 — Συγκεντρωμένη έκθεση στο “ευαίσθητο καλάθι” (Χαμηλή / Μεσαία / Υψηλή)
Χρησιμοποιούμε τρία σήματα έκθεσης:
- Αποτύπωμα ευαίσθητων κλάδων (βόειο/πουλερικά/ρύζι/ζάχαρη, παρουσία και γεωγραφική συγκέντρωση)
- “Λεπτότητα” των αποσβεστήρων εκεί που πέφτει (κατακερματισμένες εκμεταλλεύσεις, λεπτά περιθώρια, περιορισμένες εναλλακτικές στις επηρεαζόμενες περιοχές)
- Ένταση κινητοποίησης (ορατή πολιτική αλατότητα: διαδηλώσεις, απειλές βέτο, “θα ψηφίσουμε κατά”, μπλόκα με τρακτέρ)
Κανόνας απόφασης:
- Υψηλή έκθεση = ευαίσθητοι κλάδοι με πολιτικό βάρος, επίδραση συγκεντρωμένη σε πραγματικούς τόπους, πολιτική κλιμάκωση που έρχεται γρήγορα
- Μεσαία = κάποια έκθεση, που μετριάζεται από TRQs/δομή, με ασθενέστερη κινητοποίηση
- Χαμηλή = περιορισμένο αποτύπωμα/πολιτική βαρύτητα, ή διασπορά που κάνει την αντίδραση λιγότερο πιθανή
Συνδυαστικά, οι δύο άξονες παράγουν τέσσερα αποτελέσματα που επαναλαμβάνονται στην ΕΕ. Κάποιες χώρες “πιάνουν” το upside αθόρυβα, κάποιες αναβαθμίζονται υπό πίεση, κάποιες μένουν περιφερειακές ως προς τα διανεμητικά αποτελέσματα, και κάποιες μπαίνουν γρήγορα σε δυναμική συμπίεσης περιθωρίων και πολιτικής αντίδρασης.
- Ήσυχοι ωφελούμενοι
Η βιομηχανική και logistics υπεραξία φτάνει γρήγορα, και η πίεση στο “ευαίσθητο καλάθι” μένει τοπική και διαχειρίσιμη. - Διαχειριζόμενη προσαρμογή
Υπάρχει ανταγωνιστική ικανότητα, και το “ευαίσθητο καλάθι” επιβάλλει ορατές δικλείδες, εργαλεία κρίσης και αξιοπιστία επιβολής. - Περιφερειακό “pass-through”
Η Mercosur αλλάζει ελάχιστα τον εθνικό παραγωγικό χάρτη, και η συμφωνία καταγράφεται κυρίως ως “σήμα τιμών” στο υπόβαθρο, όχι ως γεγονός αναδιάρθρωσης. - Ζώνη αντίδρασης
Λεπτοί αποσβεστήρες συμπίπτουν με κλάδους υψηλής πολιτικής βαρύτητας, και ακόμη και μέτρια πίεση τιμών μετατρέπεται σε γρήγορη πολιτική κλιμάκωση.
[Εικόνα στο πρωτότυπο]
Σημείωση για τα Research Toggles: Τα panels A–D (δεδομένα/βαθμολόγηση/κανόνες) παραμένουν στην αγγλική έκδοση. Αν χρειάζεστε τα αναλυτικά στοιχεία, ανοίξτε την αγγλική έκδοση του άρθρου.
5️⃣ Πού συγκεντρώνεται η πίεση, και γιατί γίνεται πολιτική
Η συζήτηση για την ΕΕ–Mercosur μπορεί να μοιάζει συναισθηματικά και πολιτικά έντονη, ακόμη κι όταν ο μακρο-αριθμός για την ΕΕ φαίνεται μικρός. Ο μηχανισμός είναι η συγκέντρωση, και η συγκέντρωση λειτουργεί σε τρία επίπεδα.
Η ίδια η συμφωνία δείχνει ποιες κατηγορίες αγροτικών προϊόντων θεωρούνται πολιτικά ευαίσθητες, επειδή ενσωματώνει “όρια ταχύτητας” στο άνοιγμα της αγοράς για αυτά τα προϊόντα.
Ένας σωρευτικός φακός αντιμετωπίζει τη Mercosur ως μία συμφωνία μέσα σε ένα ευρύτερο χαρτοφυλάκιο εμπορικών ανοιγμάτων, και η επαναλαμβανόμενη έκθεση αλλάζει το τι φαίνεται “διαχειρίσιμο” με τον χρόνο.
Όταν η πίεση προσγειώνεται σε περιοχές με λεπτά περιθώρια, ακόμη και μικρές κινήσεις τιμών μπορούν να μεταφραστούν σε στρες επιβίωσης, τοπική οργή, και ταχεία κινητοποίηση.
Ας εμβαθύνουμε σε καθεμία από τις τρεις στρώσεις.
1) Οι ποσοστώσεις και η σταδιακή εφαρμογή είναι οι ενσωματωμένοι αποσβεστήρες σοκ της συμφωνίας
Η συμφωνία χρησιμοποιεί δύο εργαλεία για να διαχειριστεί την ευαισθησία σε συγκεκριμένα αγροτικά προϊόντα, δασμολογικές ποσοστώσεις (tariff-rate quotas, TRQs) και σταδιακή εφαρμογή (phase-ins). Αυτά τα εργαλεία έχουν σημασία, επειδή καθορίζουν τον ρυθμό και την κλίμακα του ανταγωνισμού, και συχνά αυτό αποφασίζει αν η πολιτική ένταση μένει χαμηλή ή ανεβαίνει.
Μια δασμολογική ποσόστωση (TRQ) χωρίζει τις εισαγωγές σε δύο “κανάλια”, ένας περιορισμένος όγκος μπαίνει με χαμηλότερο δασμό, και οι ποσότητες πάνω από αυτό το όριο αντιμετωπίζουν υψηλότερο δασμό. Η ποσόστωση λειτουργεί ως “ταβάνι” στη φθηνή πρόσβαση, και έτσι επιβραδύνει τις απότομες αιχμές.
Η σταδιακή εφαρμογή απλώνει τη φιλελευθεροποίηση στον χρόνο. Το άνοιγμα της αγοράς έρχεται ως ράμπα και όχι ως σκαλοπάτι, και αυτό δίνει περισσότερο “διάδρομο” προσαρμογής σε παραγωγούς και θεσμούς.
Γιατί αυτό είναι πολιτικό σήμα
Όταν η Επιτροπή τονίζει TRQs και σταδιακή έκθεση για βόειο, πουλερικά, ρύζι, αιθανόλη και ζάχαρη, στην πράξη επισημαίνει τα προϊόντα όπου περιμένει τη μεγαλύτερη πολιτική αλατότητα. Η ίδια η σχεδιαστική επιλογή λειτουργεί ως ένδειξη για το πού η ΕΕ θεωρεί ότι μπορεί να συγκεντρωθεί η πίεση. (Commission agriculture factsheet)
Αυτά τα εργαλεία ρυθμίζουν την ταχύτητα και την οροφή των πιο ορατών σημείων πίεσης, και συχνά αυτό καθορίζει αν η προσαρμογή θα μοιάζει τακτοποιημένη ή αποσταθεροποιητική.
2) Ο σωρευτικός φακός μετακινεί το ερώτημα από “μία συμφωνία” σε “πίεση χαρτοφυλακίου”
Η δεύτερη στρώση είναι εκεί όπου πολλοί αναγνώστες χάνουν τον ειρμό, επειδή ο όρος “σωρευτική επίπτωση” ακούγεται ακαδημαϊκός. Στην πράξη είναι απλός.
Μια σωρευτική ανάγνωση ρωτά:
- Πόση πίεση συσσωρεύεται στις ίδιες κατηγορίες αγροτικών προϊόντων μέσα από πολλαπλές εμπορικές συμφωνίες στον χρόνο, αντί να αντιμετωπίζουμε κάθε συμφωνία ως ένα μεμονωμένο γεγονός;
Γιατί το πλαίσιο χαρτοφυλακίου έχει πολιτική σημασία
Για πολλούς παραγωγούς της υπαίθρου, η βιωμένη εμπειρία δεν είναι ένα μοναδικό σοκ με καθαρή ανάκαμψη. Είναι επαναλαμβανόμενοι γύροι ανταγωνισμού, και κάθε γύρος επηρεάζει επενδυτικές αποφάσεις, χρέος, περιθώρια και προσδοκίες, και αυτό συσσωρεύει μακροχρόνια ένταση που γίνεται ζήτημα αξιοπιστίας.
Τι κάνει εδώ το JRC
Η ανάλυση του JRC κοιτά την ευαλωτότητα σε επίπεδο χαρτοφυλακίου, και αναδεικνύει βόειο, αιγοπρόβειο, πουλερικά, ρύζι και ζάχαρη ως κλάδους που εμφανίζονται συστηματικά ως “ευάλωτοι” όταν οι εμπορικές συμφωνίες αξιολογούνται σωρευτικά. (JRC — cumulative impact report)
Αυτές είναι οι κατηγορίες όπου η πίεση τείνει να επανέρχεται, και όπου το πολιτικό σύστημα καταλήγει να ξανανοίγει το ίδιο ερώτημα νομιμοποίησης, ξανά και ξανά.
3) Η συγκέντρωση μετατρέπει τη μικρή οικονομική μεταβολή σε τοπική πολιτική υψηλής έντασης
Η τελευταία στρώση εξηγεί τη συναισθηματική “θερμοκρασία”. Η πολιτική προκύπτει εκεί όπου η επίδραση γίνεται ορατή σε τόπους και ταυτότητες.
Οι μέσοι όροι της ΕΕ “ισιώνουν” την τοπική συγκέντρωση
Μια μεγάλη οικονομία μπορεί να εμφανίζει μικρή μέση επίδραση, και ταυτόχρονα να δημιουργεί “θύλακες” έντονης αναστάτωσης. Η πολιτική μορφοποιείται σε αυτούς τους θύλακες, επειδή εκεί είναι πιο ορατές οι ιστορίες βιοπορισμού και ταυτότητας.
Τι σημαίνουν οι “λεπτοί αποσβεστήρες” στην πράξη
Οι λεπτοί αποσβεστήρες είναι οι συνθήκες που μετατρέπουν μικρή πίεση τιμών σε γρήγορο στρες. Συνήθως περιλαμβάνουν:
- Κατακερματισμένες εκμεταλλεύσεις και μικρή κλίμακα, που ανεβάζουν το μοναδιαίο κόστος και μειώνουν την ευελιξία, και αυτό είναι δομικό χαρακτηριστικό σε τμήματα της ευρωπαϊκής γεωργίας. Τα στατιστικά της Eurostat για τη δομή εκμεταλλεύσεων δείχνουν ότι μεγάλο μερίδιο των εκμεταλλεύσεων είναι πολύ μικρό, με την πλειονότητα κάτω από 5 εκτάρια. (Eurostat statistics — Farms and farmland in the European Union)
- Λεπτά περιθώρια και ευθραυστότητα ρευστότητας, που κάνουν ακόμη και μέτρια πίεση τιμών να βιώνεται ως υπαρξιακή. Ένας βασικός λόγος είναι ότι ένα ουσιαστικό μερίδιο του αγροτικού εισοδήματος “συμπληρώνεται” ήδη από δημόσια στήριξη, και το Ευρωπαϊκό Ελεγκτικό Συνέδριο σημειώνει ότι οι άμεσες ενισχύσεις αποτελούν σταθερό στοιχείο εισοδήματος και λειτουργούν ως buffer, με εκτίμηση της Επιτροπής ότι αντιστοιχούν περίπου στο 26% του εισοδήματος των αγροτών. (European Court of Auditors)
- Αδύναμη διαπραγματευτική ισχύς μέσα στην αλυσίδα αξίας, που μεταφέρει το βάρος προσαρμογής προς τους παραγωγούς. Η βιβλιογραφία του OECD επισημαίνει ότι τα downstream στάδια είναι συνήθως πιο συγκεντρωμένα από το επίπεδο της πρωτογενούς παραγωγής, και αυτό υπονομεύει τη διαπραγματευτική ισχύ των αγροτών στη διαμόρφωση τιμών, ενώ και η ατζέντα της ΕΕ για τις αθέμιτες εμπορικές πρακτικές βασίζεται στην ίδια διάγνωση, ότι οι αγρότες είναι συχνά ο ασθενέστερος κρίκος και χρειάζονται προστασία από ισχυρότερους αγοραστές. (OECD; European Council of the European Union)
- Περιορισμένη μεταποίηση, αποθήκευση και logistics, που μειώνουν την προστιθέμενη αξία και την ανθεκτικότητα. Όταν οι περιφέρειες στερούνται downstream δυνατοτήτων, έχουν λιγότερους μοχλούς για να μετακινηθούν από ανταγωνισμό commodity σε ανταγωνισμό αξίας, και έτσι η πίεση τιμών περνά πιο άμεσα στο εισόδημα.
- Λιγότερες εναλλακτικές δουλειές τοπικά, που μετατρέπουν την “προσαρμογή” σε “παρακμή” στην δημόσια αφήγηση. Αυτό είναι το κανάλι πολιτικής οικονομίας, επειδή όταν οι επιλογές εξόδου είναι λίγες, οι αγρότες και οι εργαζόμενοι της υπαίθρου διαβάζουν τον ανταγωνισμό ως απειλή κοινότητας, και αυτό ανεβάζει την ένταση κινητοποίησης και δημιουργεί πολιτική βέτο.
Συνδυάζοντας τα παραπάνω, η πολιτική γίνεται προβλέψιμη. Οι ποσοστώσεις και οι σταδιακές εφαρμογές μπορούν να κρατήσουν μικρό το σοκ σε επίπεδο ΕΕ, και ταυτόχρονα να αφήσουν πολύ ορατό τοπικό στρες όπου ευάλωτοι κλάδοι συμπίπτουν με περιοχές λεπτών αποσβεστήρων, επειδή το “ευαίσθητο καλάθι” της συμφωνίας αντιστοιχεί σε πραγματικούς τόπους με πραγματικές ταυτότητες απασχόλησης.
Γιατί η αγροτική πολιτική κλιμακώνεται γρήγορα
Όταν η πίεση πέφτει σε αυτές τις συνθήκες, η ιστορία της προσαρμογής γίνεται προσωπική και τοπο-κεντρική. Ο κλάδος βιώνεται ως άγκυρα βιοπορισμού σε μια συγκεκριμένη περιφέρεια, και φέρει συμβολικό βάρος σε εθνικό επίπεδο, επειδή η παραγωγή τροφίμων και η αγροτική ζωή συνδέονται με δικαιοσύνη, αξιοπρέπεια και αναγνώριση.
Σε μια περιφέρεια με ισχυρό συντονισμό, σύγχρονα logistics και ρεαλιστικές διαδρομές αναβάθμισης, ο ανταγωνισμός μπορεί να μοιάζει με ώθηση προς υψηλότερη αξία και ανακατανομή. Σε μια περιφέρεια με κατακερματισμένη παραγωγή και αδύναμους αποσβεστήρες, ο ίδιος ανταγωνισμός μπορεί να μοιάζει με συμπίεση περιθωρίων, άγχος και απειλή για τη συνέχεια του τόπου.
6️⃣ Γιατί διαφωνούν οι ειδικοί, και γιατί η διαφωνία επιμένει ⚔️
Η διαμάχη ζει μέσα σε υποθέσεις και στην αξιοπιστία εφαρμογής, και επιμένει επειδή τα αποτελέσματα του εμπορίου εξαρτώνται από το πόσο ρεαλιστική είναι η μετάβαση. Αλλάζει η ιστορία προσαρμογής, αλλάζει το πόσο δεσμευτικές γίνονται οι ποσοστώσεις στην πράξη, και αλλάζει επίσης αν βλέπεις τη συμφωνία ως μεμονωμένο σοκ ή ως μέρος ενός χαρτοφυλακίου, και έτσι αλλάζουν τα συμπεράσματα.
Τρεις διακλαδώσεις που αλλάζουν τον χάρτη πολιτικού ρίσκου:
- Ρεαλισμός προσαρμογής: ομαλή ανακατανομή στα μοντέλα, τριβή σε πραγματικές πόλεις και κωμοπόλεις.
- Δυναμική ποσοστώσεων: δεσμευτικές ποσοστώσεις, μερική αξιοποίηση, ή στρατηγικό timing.
- Σωρευτική έκθεση: Mercosur μόνη της, ή σωρευτική πίεση μέσα στο ευρύτερο εμπορικό πρόγραμμα. (JRC — cumulative lens)
Η Ευρώπη μπορεί να κερδίζει μικρά μακρο-οφέλη, και ταυτόχρονα να αντιμετωπίζει πολιτική υψηλής έντασης, επειδή το μοτίβο κατανομής αποφασίζει τη νομιμοποίηση. Η πολιτική διαφωνία παραμένει, επειδή διαφορετικές αναγνώσεις αυτού του μοτίβου οδηγούν σε διαφορετική εκτίμηση ρίσκου.
🔽 [Panel στο πρωτότυπο] Expert Disagreements & Debates
Η συμφωνία ΕΕ–Mercosur έχει πυροδοτήσει έντονη αντιπαράθεση μεταξύ ειδικών, stakeholders και πολιτικών, και συχνά χωρίζει σε στρατόπεδα pro-growth vs anti-displacement, με υποκείμενες διαφορές αξιών και εμπιστοσύνης:
• Ανάπτυξη vs Εκτόπιση
Οι υποστηρικτές (συμπεριλαμβανομένης της Ευρωπαϊκής Επιτροπής, πολλών οικονομολόγων και ομάδων εξαγωγικών κλάδων) υποστηρίζουν ότι η συμφωνία είναι win-win, με συνολική ανάπτυξη, περισσότερες δουλειές και οφέλη για τους καταναλωτές. Δίνουν έμφαση στο μικρό αλλά θετικό κέρδος σε ΑΕΠ/ευημερία (European Parliament (DG EXPO) study, 2025; Sustainability Impact Assessment (LSE), 2020) και σε στρατηγικά πλεονεκτήματα, όπως η διαφοροποίηση εμπορίου μακριά από την Κίνα (OeNB Bulletin Q4/25, 2025; Thünen Institute update, 2025). Οι αντίπαλοι (αγροτικά συνδικάτα, περιβαλλοντικές ΜΚΟ, ορισμένοι ακαδημαϊκοί) απαντούν ότι τα μακρο-οφέλη είναι ασήμαντα ή απατηλά, και ότι έρχονται με κόστος επώδυνη κλαδική εκτόπιση, επειδή το +0,1% στο ΑΕΠ δεν αποτυπώνει τα κοινωνικά κόστη απώλειας εργασιών στην ύπαιθρο ούτε τη δυσκολία “ανακύκλωσης” της εκτοπισμένης αγροτικής εργασίας (Austrian Chamber of Labour (AK Wien), 2021; Sustainability Impact Assessment (LSE), 2020). Η εμπειρική διαφωνία καταλήγει στο αν εμπιστεύεσαι τις προβλέψεις των μοντέλων και αν θεωρείς εφικτή μια ομαλή αντιστάθμιση των χαμένων.
• Περιβάλλον και εφαρμογή προτύπων
Υπάρχει ευρεία διαφωνία για το πόσο αξιόπιστο είναι αυτό το σκέλος. Η Επιτροπή επιμένει ότι η συμφωνία “δεν θα προκαλέσει αποψίλωση”, και δείχνει νέες διατάξεις βιωσιμότητας (TSD chapter, Paris Agreement language, και παράλληλα εργαλεία της ΕΕ για την αποψίλωση) ως safeguards (European Parliament (DG EXPO) study, 2025; European Parliament Legislative Train — state of play). Τονίζει επίσης ότι οι εισαγωγές οφείλουν να συμμορφώνονται με τους κανόνες SPS και ασφάλειας τροφίμων της ΕΕ (συμπεριλαμβανομένων απαγορεύσεων όπως στο hormone-treated beef) (European Commission factsheet for farmers, Sep 2025; Thünen Institute update, 2025). Οι επικριτές μιλούν για “empty promises” και τονίζουν την απουσία ή αδυναμία κυρώσεων για περιβαλλοντικές παραβιάσεις (OeNB Bulletin Q4/25, 2025; European Parliament Legislative Train — state of play), και υποστηρίζουν ότι η συμφωνία μπορεί να ενισχύσει την αποψίλωση μέσω επέκτασης παραγωγής βοείου και σόγιας. Μελέτη του 2023 (Institut de l’Élevage για τους Greens/EFA) εκτίμησε ότι, σε worst-case σενάρια, η ποσόστωση βοείου θα μπορούσε να συσχετιστεί με 620.000 έως 1,35 εκατ. εκτάρια πρόσθετης αποψίλωσης στον Αμαζόνιο σε πέντε χρόνια (Greens/EFA — Institut de l’Élevage study, 2023).
• Αξιοπιστία και εμπιστοσύνη
Η αμφιβολία επιμένει για το αν οι κυβερνήσεις Mercosur θα τηρήσουν δεσμεύσεις, και για το αν η ΕΕ θα ενεργοποιήσει safeguards αρκετά γρήγορα. Οι αγρότες και οι ΜΚΟ αναφέρονται σε προηγούμενα rollback και όρια επιβολής στον Αμαζόνιο (Greens/EFA — Institut de l’Élevage study, 2023), ενώ το “joint instrument” της ΕΕ για την αποψίλωση δεν έχει πείσει πλήρως τους επικριτές (European Parliament Legislative Train — state of play). Οι αγρότες επίσης αμφισβητούν αν η Επιτροπή θα ενεργοποιούσε διμερείς δικλείδες όταν οι εισαγωγές “απειλούν” ζημία, ή αν η πολιτική καθυστέρηση θα επικρατούσε μέχρι να γίνει η ζημιά (European Parliament (DG EXPO) study, 2025). Αυτό το κενό αξιοπιστίας εξηγεί αιτήματα για “emergency brake” και αυστηρότερες διαβεβαιώσεις για φυτοφάρμακα (TRT World/AFP — Macron statement, Jan 8 2026), ενώ οι υποστηρικτές αντιτείνουν ότι προηγούμενες συμφωνίες της ΕΕ δεν κατέρρευσαν την ευρωπαϊκή γεωργία, και ότι οι ποσοστώσεις μπορεί να μην γεμίζουν λόγω συνθηκών αγοράς, με το Thünen Institute να βρίσκει ότι κανένας κλάδος της ΕΕ δεν θα συρρικνωθεί πάνω από 1,5% και να τονίζει τη δυναμική υπο-αξιοποίησης ποσοστώσεων (Thünen Institute update, 2025).
Συνολικά, η διαφωνία των ειδικών προκύπτει από διαφορετικές εμπειρικές ερμηνείες (αισιοδοξία μοντέλων έναντι ιστορικού σκεπτικισμού), από διαφορές αξιών (οικονομικός φιλελευθερισμός έναντι προληπτικής προστασίας γεωργίας και περιβάλλοντος), και από κρίσεις αξιοπιστίας (εμπιστοσύνη σε Mercosur και θεσμούς της ΕΕ για την εφαρμογή safeguards). Η συζήτηση “ανάπτυξη vs εκτόπιση” αφορά επίσης το τι ιεραρχεί η Ευρώπη, ένα μικρό κέρδος ΑΕΠ και έναν γεωπολιτικό σύνδεσμο, ή τη θωράκιση περιβαλλοντικών δεσμεύσεων και του αγροτικού ιστού.
Ο συμβιβασμός που διαμορφώνεται, με πρόσθετες δικλείδες, πόρους και monitoring, επιχειρεί να μειώσει αυτά τα χάσματα. Το αφηγηματικό κενό παραμένει μεγάλο.
7️⃣ Η ισχύς που ταξιδεύει μέσω αγορών, χρειάζεται να “κουβαληθεί” από τόπους
Η εμπορική στρατηγική της Ευρώπης λειτουργεί όλο και περισσότερο ως εξωτερική πολιτική, επειδή η Ενιαία Αγορά είναι εργαλείο που κινείται ταχύτερα από την αναδόμηση βιομηχανικού βάθους. Ο βαθύτερος περιορισμός είναι ότι κάθε εξωτερικό άνοιγμα “μπαίνει” στο εσωτερικό μέσα από πραγματικούς τόπους, και οι πραγματικοί τόποι αποφασίζουν αν η στρατηγική της Ευρώπης βιώνεται ως νόμιμη.
Η ΕΕ–Mercosur γίνεται έτσι ένα stress test για ένα γνώριμο ευρωπαϊκό πρόβλημα, την άνιση ετοιμότητα μέσα στην Ένωση. Κάποιες περιφέρειες μετατρέπουν την πίεση σε αναβάθμιση, κάποιες τη μετατρέπουν σε ρίσκο αντίδρασης, και αυτή η απόκλιση συσσωρεύεται πολιτικά ακόμη κι όταν ο αριθμός σε επίπεδο ΕΕ μένει μικρός.
Η συμφωνία είναι επιλογή για εταίρους στη Λατινική Αμερική, και ταυτόχρονα επιλογή για τον εσωτερικό ρυθμό της Ευρώπης. Αποκαλύπτει αν η Ευρώπη μπορεί να κινείται προς τα έξω, κρατώντας αρκετή θεσμική ταχύτητα και τοπική ικανότητα αποσβέσεων, ώστε η συγκεντρωμένη προσαρμογή να μη σκληραίνει σε ταυτότητα μόνιμου παραπόνου.
Τα ίδια ερωτήματα που μπέρδεψαν πολλούς στην Ευρωπαϊκή Κρίση Χρέους παραμένουν ανοιχτά, και σήμερα είναι ξανά κεντρικά.
Ποια μορφή παίρνει η Ένωση όταν η ετοιμότητα, και όχι οι θεσμικές διακηρύξεις, γίνεται ο ισχυρότερος προγνωστικός δείκτης σταθερότητας υπό σοκ ανταγωνισμού;
Ποιον «μέσο Ευρωπαίο» εξυπηρετεί μια στρατηγική που θεωρεί επαρκή τα «μικρά κέρδη κατά μέσο όρο», ακόμη κι όταν το κόστος συγκεντρώνεται σε συγκεκριμένους τόπους και κλάδους;
Πόσο πολιτικό κεφάλαιο αντέχει να καταναλώσει σε περιοχές με λεπτά περιθώρια, πριν αρχίσει να περιορίζεται η εξωτερική της ισχύς από την εσωτερική φθορά;
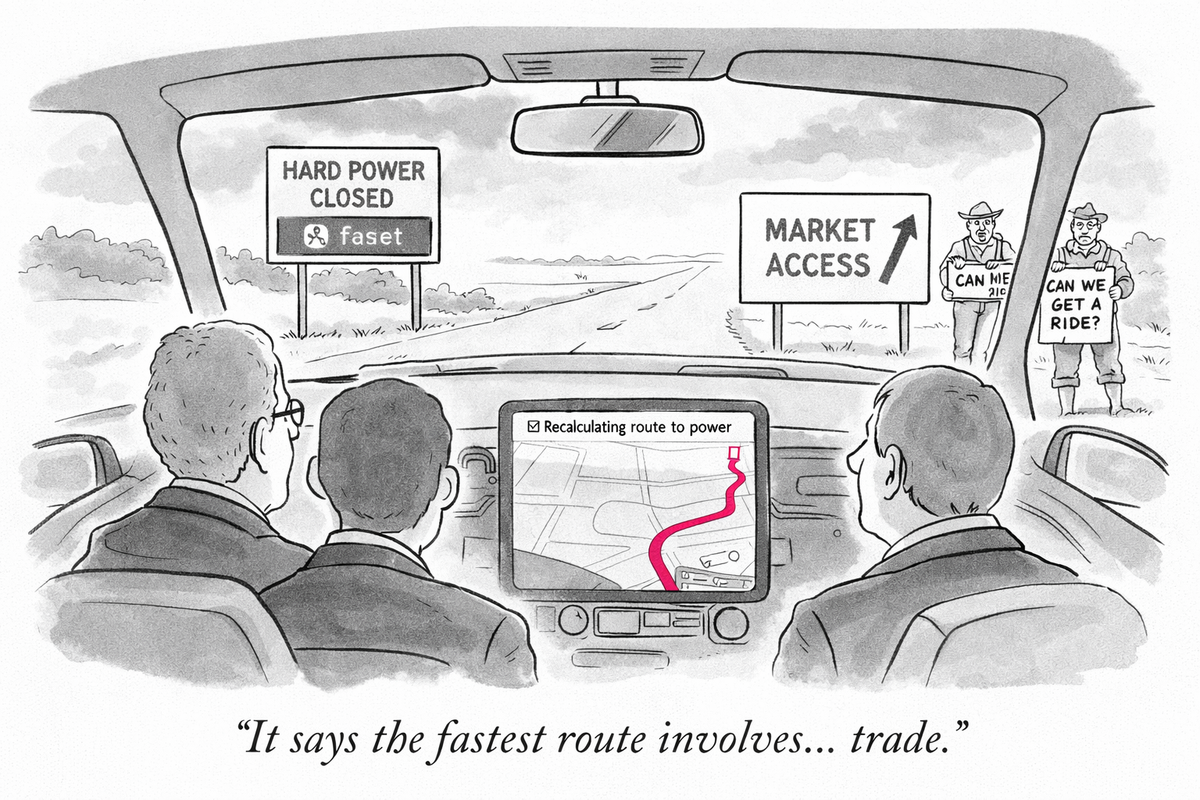
Same agreement, radically different outcomes, because readiness decides how competition lands.
In Europe’s Hollowing-Out Moment, we discussed how Europe’s vulnerability grows when material depth, industrial tempo, and institutional speed stop matching the shocks of its environment. That imbalance pushes European strategy toward instruments that scale fast, and market access remains the EU’s most deployable form of power.
EU–Mercosur fits that pattern. Europe may be using a trade agreement as a geopolitical move, because it reshapes partnership, standards alignment, and supply relationships across a large region, and it does so through the Single Market rather than through hard power.
This agreement has been negotiated since 1999 and it was politically re-activated for signature in January 2026, even though the Commission-commissioned modelling projects EU welfare gains of €6.3–€8.6bn (2011 euros) by 2032 and the sectoral pressure concentrates in politically sensitive farming segments such as beef/sheep and sugar. (Council press release — negotiations began 1999, signature greenlit 9 Jan 2026 ; Reuters — “after 25 years”, Jan 9 2026 ; SIA — welfare and sector outputs). That combination, a quarter-century of negotiation for single-digit billions of aggregate welfare alongside concentrated local exposure, may point to reading the deal potentially as geopolitics conducted through market access, as it becomes a stress test for regional jobs. (SIA — welfare and sector outputs)
This is €14–€19 benefit per EU resident
TL;DR (1 minute) ⚡
- What happened: EU member states cleared the deal for signing this week, with reporting pointing to a 17 January 2026 signing in Paraguay, and European Parliament consent remains a required gate before the interim trade agreement can fully enter into force. (Reuters — approval ; Reuters — signing timeline ; European Commission — process notes)
- What the economics says: Commission-commissioned modelling projects EU GDP at about +0.1% by 2032 versus baseline, with welfare gains of €6.3–€8.6bn (2011 euros), and the output declines concentrate most clearly in beef/sheep and sugar in the conservative scenario. (SIA — LSE Consulting final report). That's €14–€19 per EU resident (Using the EU’s population estimate of 450.4 million people (1 Jan 2025, Eurostat).
- What the political fault line is: “Ready Europe” tends to translate price pressure into upgrading and reallocation, and “Unready Europe” tends to experience it as margin compression and rural backlash risk.
EU–Mercosur functions as a stress test of Europe’s internal economic geography. The same external opening produces transition in some places, and dislocation politics in others.
WHY THIS DEAL IS GEOPOLITICAL 🔭
Europe’s trade policy increasingly carries geopolitical weight, because access to the Single Market is leverage that moves faster than industrial rebuilding. That leverage becomes more valuable when the international system rewards bloc formation, standards alignment, and resilient supply corridors.
Four ways the “power play” shows up in practice:
- Partner-map shaping: the deal deepens Europe’s strategic presence in Latin America through rules, standards, and preferential access, and that framing appears prominently in current coverage and political debate. (Financial Times — member states back the deal ; The Guardian — EU states back controversial deal)
- Rules and standards export: trade agreements extend the EU’s regulatory perimeter through compliance requirements, traceability norms, and market-entry conditions, and those mechanisms matter as much as tariffs for long-run alignment. (European Commission — agreement text and process notes)
- Supply security logic: the deal operates in the same strategic space as resilience concerns, because diversification and reliability increasingly matter across the full trade portfolio, especially when shocks compound. (JRC — cumulative impact framing)
- Domestic cohesion constraint: the agreement’s geopolitical upside remains gated by local adjustment capacity, because sectoral concentration drives legitimacy risk and shapes parliamentary politics. (SIA — distributional results ; JRC — vulnerable sectors lens)
NUMBERS AT A GLANCE 🔢
(2032 vs baseline; € in 2011 euros)
EU macro impact (CGE modelling) — SIA results tables
| Metric | Conservative scenario | Ambitious scenario |
|---|---|---|
| EU GDP impact | +0.1% (≈ €10.9bn) | +0.1% (≈ €15.0bn) |
| EU welfare gain | €6.3bn | €8.6bn |
Market access “shock absorbers” (TRQs, phase-ins, tariff treatments) — Commission agriculture factsheet
| Product | Quota design | Scale framing (Commission factsheet) |
|---|---|---|
| Beef | 99,000 tonnes TRQ, 7.5% duty | ≈ 1.5% of EU production |
| Poultry | 180,000 tonnes duty-free TRQ, phased in over 5 years | ≈ 1.3% of EU production |
| Rice | 60,000 tonnes duty-free TRQ, phased in over 5 years | ≈ 1.4% of EU consumption |
| Sugar | 180,000 tonnes raw cane sugar for refining (existing WTO quota) + 10,000 tonnes for Paraguay | Factsheet framing |
| Ethanol | 450,000 tonnes duty-free (chemical) + 200,000 tonnes at one-third duty (other uses), phased in over 5 years | Factsheet framing |
Sector output changes (EU28, conservative scenario) — SIA sector outputs
| Sector (SIA label) | Modelled output change |
|---|---|
| Beef and sheep meat | −0.7% |
| Sugar | −0.7% |
| Rice | −0.4% |
| Poultry meat, pork | −0.2% |
EU member states cleared the agreement for signature on 9 January 2026, and that decision shifted the deal from long negotiation to short political timing. (Reuters — approval ; Financial Times — coverage ; The Guardian — coverage)
European Parliament consent remains a required gate for the interim Trade Agreement to enter fully into force, and that institutional step will concentrate lobbying and coalition arithmetic. (European Commission — process notes)
Reporting points to a signature ceremony planned for 17 January 2026 in Paraguay, and the signing moment tends to sharpen domestic narratives into a simple choice: openness with compensation, or resistance with veto points. (Reuters — signing timeline)
The macro impact stays modest because the EU is a large, diversified economy, and marginal efficiency gains remain small in percentage terms. The SIA reports EU GDP at about +0.1% by 2032 versus baseline, and EU welfare gains of €6.3bn (conservative) and €8.6bn (ambitious), expressed in 2011 euros. (SIA — CGE results)
Distribution determines the political temperature because sector impacts cluster, and clustered impacts map onto real places. In the SIA conservative scenario, output declines concentrate in beef and sheep meat (−0.7%) and sugar (−0.7%), with smaller declines in rice (−0.4%) and poultry meat and pork (−0.2%). (SIA — sector outputs)
Europe debates trade through EU averages, and Europe votes on trade through local adjustment realities. That difference turns an EU-level rounding error into a regional jobs question.
Readiness describes a country’s capacity to absorb price pressure and still deliver stable livelihoods, and it predicts whether competition becomes upgrading or grievance. It combines productivity, bargaining power, compliance capacity, and adaptation speed, and those capabilities decide how quickly a sector can move from volume competition to value competition.
A readiness checklist that predicts political outcomes ✅
- Productivity and cost position, including input resilience and energy exposure.
- Co-ops and bargaining power, including how margins get negotiated across the value chain.
- Logistics capacity, including storage, cold chain, and transport that protect value.
- Compliance throughput, including traceability, audits, and inspections that turn standards into routine.
- Adaptation speed, including the ability to pivot product mix, move up the value chain, or exit with support.
Europe’s internal map drives the outcome because buffers differ across regions. A treaty that feels incremental in one place can feel existential in another.
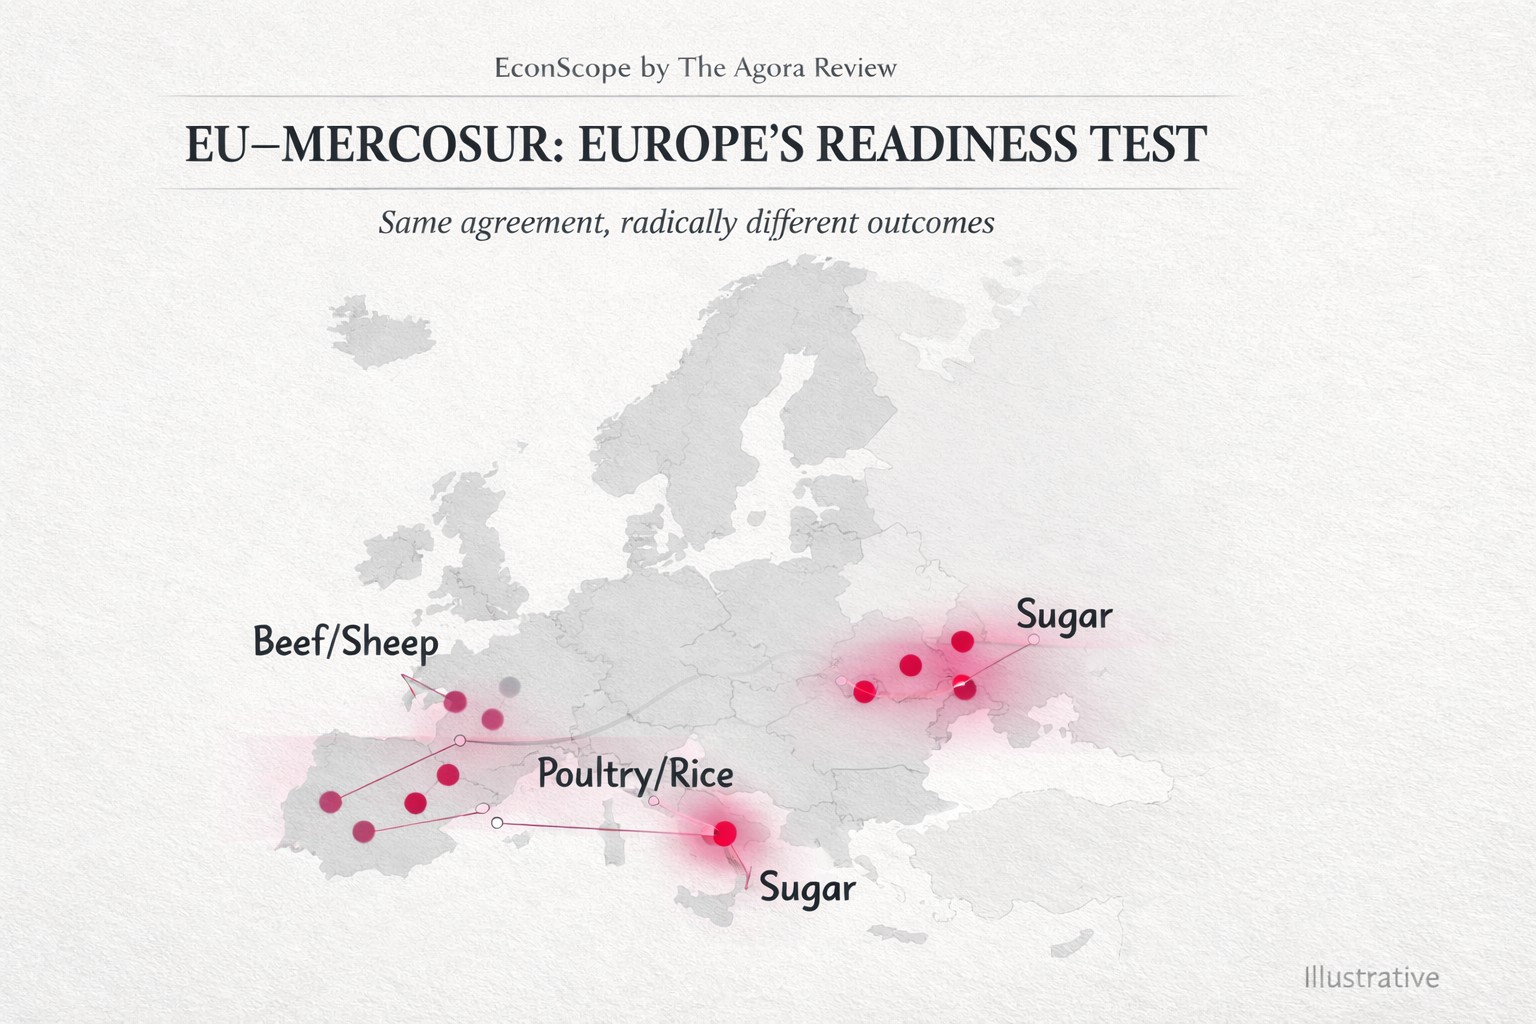
EU–Mercosur becomes visible through Europe’s regions. The agreement changes margins and opportunities inside specific local sectors, and those local systems decide whether competition becomes upgrading or backlash. Price pressure, market access, and adjustment costs land inside Europe’s regional production systems, and those systems differ sharply in buffers, coordination, and speed. That is why one treaty can feel like incremental transition in one part of the Union and like a legitimacy shock in another.
To make that mechanism readable, we can place countries on a simple (illustrative) 2×2 matrix. (You can find the detailed country evidence and the readiness gaps in the research toggles at the end of section 4. Placement reflects evidence in Research Toggle A (distribution) and Toggle B (readiness gaps), using the signal-based banding rules described here. Toggles C-D include final country rankings, values and numeric rules).
Axis 1 — Readiness to absorb competition (Low / Medium / High)
We use three observable signals you already discuss repeatedly:
- Production efficiency & structure (productivity, mechanization, scale)
- Value-chain coordination (co-ops, processing, logistics)
- Execution capacity (CAP implementation/control credibility, ability to translate funds into modernization)
Decision rule:
- High readiness = 2–3 clearly strong signals
- Medium = mixed signals
- Low = 2–3 signals clearly weak / “unready”
Axis 2 — Concentrated exposure in the sensitive basket (Low / Medium / High)
We use three exposure signals:
- Sensitive-sector footprint (beef / poultry / rice / sugar presence + geographic concentration)
- Buffer thinness where it lands (fragmented farms, thin margins, limited alternatives in the affected regions)
- Mobilization intensity (visible political salience: protests, veto threats, “will vote against”, tractor blockades)
Decision rule:
- High exposure = sensitive sectors are salient + impact concentrated in real places + politics escalates fast
- Medium = some sensitive exposure, moderated by TRQs/structure, weaker mobilization
- Low = limited sensitive footprint/salience, or dispersion makes backlash less likely
Put together, these two axes generate four outcomes that repeat across the EU. Some countries capture upside quietly, some upgrade under pressure, some remain peripheral to the deal’s distributional effects, and some move quickly into margin compression and backlash dynamics.
- QUIET BENEFICIARIES
Industrial and logistics upside arrives quickly, and the sensitive-basket pressure stays local and containable. - MANAGED ADJUSTMENT
Competitive capacity exists, and the sensitive basket still forces visible safeguards, crisis tools, and enforcement credibility. - PERIPHERAL PASS-THROUGH
Mercosur barely moves the national production map, and the deal registers mainly as background price signal rather than a restructuring event. - BACKLASH BELT
Thin buffers coincide with salient sectors, and even moderate price pressure converts into fast political escalation.
A. Click to Expand: North–South & Sectoral Distribution
The agreement’s impact will vary widely across EU regions and sectors, often splitting along North–South and center–periphery lines:
• Germany & Industrialized North: Germany exemplifies the Northern industrial export powerhouse that wins under Mercosur. German firms (autos, machinery, chemicals) gain improved access to Mercosur’s high-tariff markets (e.g. Brazil’s 35% car tariff) (European Parliament (DG EXPO) study, 2025). By 2040, Germany is projected to have a slight GDP uptick (~+0.05%) from the deal (OeNB Bulletin Q4/25, 2025). German cars, machine tools, and pharma are expected to see billions in tariff savings (EU exporters collectively save ~€4 billion in duties yearly under the deal) (TRT World/AFP — “EU countries override France…”, Dec 2025). Employment in German manufacturing could expand modestly (the SIA showed +0.11% manufacturing jobs EU-wide) (Sustainability Impact Assessment (LSE), 2020). Agriculturally, Germany is less exposed – it’s a net beef exporter and has competitive pork/poultry sectors. Still, German farmers worry about cheap imports undermining sectors like poultry or honey (Brazil is a big honey exporter). But overall, Germany strongly supports the pact, emphasizing geopolitical and supply-chain benefits. Chancellor Merz hailed it as a “milestone…signal of our strategic sovereignty” (TRT World/AFP — “EU countries override France…”, Dec 2025). This pro-trade stance reflects Germany’s winners (export industries, consumers) outweighing losers. Germany also counts on critical raw materials access (Mercosur minerals, etc.) to diversify away from China (TRT World/AFP — “EU countries override France…”, Dec 2025) – a strategic motive beyond GDP.
• France: France is positioned as the prime loser/critic in the EU. With its large farming sector (beef, poultry, sugar, cereals) and a strong political voice for farmers, France has vehemently opposed the deal “as it stands” (Austrian Chamber of Labour (AK Wien), 2021). French beef and sugar producers are explicitly identified as vulnerable – EU beef output could drop ~1–1.2%, largely concentrated in France and Ireland (Austrian Chamber of Labour (AK Wien), 2021). French officials fear “a flow of cheaper [agri] goods” undercutting domestic farmers (TRT World/AFP — “EU countries override France…”, Dec 2025). Indeed, Mercosur’s competitive advantage in beef, poultry, sugar, ethanol directly challenges French producers. The political backlash is strong: the French Parliament unanimously rejected the deal, and President Macron declared it a “deal from another era” that France will vote against (TRT World/AFP — Macron statement, Jan 8 2026). He pointed to unfair competition for farmers and insufficient guarantees on environment and standards (TRT World/AFP — Macron statement, Jan 8 2026). France did negotiate concessions – an “emergency brake” safeguard on farm imports and some reciprocity on production standards (e.g. pesticides) (TRT World/AFP — Macron statement, Jan 8 2026) – but remains unconvinced. Distributionally, France does have potential winners: its famous wine & spirits industry gains from Mercosur tariff elimination (up to 27% duties removed) (European Commission factsheet for farmers, Sep 2025), and French cars/industries would also benefit somewhat. However, these gains are diffuse, while the losers (beef farmers, sugar beet growers, poultry producers) are concentrated and politically mobilized. France’s stance illustrates a value-based and distributional conflict: marginal GDP gains and export opportunities are, in its view, outweighed by threats to rural livelihoods and environmental values. In summary, France expects more displacement than growth, especially in its rural heartlands, making it the leading internal opponent of the pact.
• Spain & Portugal: Southern Europe has a nuanced position. Spain and Portugal have mixed interests – a foot in both agricultural and industrial camps. Spain is poised to gain via its industrial base and globalized agri-food firms: Spanish car manufacturers (e.g. SEAT) and machinery exporters will gain from Mercosur tariff cuts, and Spanish wine, olive oil, and dairy will get better access (e.g. EU cheese quota of 30,000 t for Mercosur) (European Commission factsheet for farmers, Sep 2025). Spain’s extra-EU export share to Mercosur is relatively high (~5% of its global exports) (European Parliament (DG EXPO) study, 2025), indicating offensive interests. At the same time, Spain’s farmers could face competition in beef, citrus, rice, and sugar. Notably, cheap Mercosur beef and poultry challenge Spain’s domestic meat sector (Spain has a significant beef feedlot industry). Mercosur is also a world player in rice and citrus – products grown in Spain’s south. Spanish rice growers (e.g. in Andalusia) fear imports, as EU rice tariffs will be partly liberalized; France explicitly cited rice among concerns (TRT World/AFP — “EU countries override France…”, Dec 2025) (Uruguay is a rice exporter). However, internal analysis suggests these impacts are moderate: e.g. Spanish beef farmers might see prices soften, but not collapse (thanks to TRQs). The Spanish government, balancing these factors, has generally supported the deal (Spain joined Germany in favor), emphasizing the export upside for “hampered industries” and the opportunity to strengthen ties with Latin America (TRT World/AFP — “EU countries override France…”, Dec 2025). Portugal, meanwhile, actually has the highest Mercosur import exposure in the EU (nearly 15% of Portugal’s extra-EU imports come from Mercosur) (European Parliament (DG EXPO) study, 2025) – mostly due to soy for feed, beef, coffee, and other commodities from Brazil. This high dependence means Portuguese consumers and feed buyers have benefitted from Mercosur supplies, but domestic producers (e.g. Portuguese cattle farmers, dairy) are vulnerable if those imports grow. Portugal’s export gains from the deal are relatively modest (only ~1% of its extra-EU exports go to Mercosur) (European Parliament (DG EXPO) study, 2025), but its economy could indirectly gain from any boost to Spanish industry or via port logistics (e.g. Porto, Sines ports). Politically, Portugal has been supportive of Mercosur integration (reflecting historical Brazil ties), but is keenly aware of the need for modernization support for its farmers. In sum, Spain and Portugal stand to gain in export sectors (cars, machinery, food exports like olive oil/wine) while feeling pressure on certain farm sectors. Within these countries, winners will be industrial regions (e.g. Spain’s Catalonia and Basque Country for manufacturing, Rioja for wine exports) and losers likely in more rural, less competitive farming areas (e.g. beef farmers in Spain’s grassland regions, rice farmers around the Guadalquivir, or smallholders in Portugal’s Alentejo).
• Denmark: Denmark illustrates the case of a highly efficient agricultural exporter that is cautiously optimistic about Mercosur. Danish industry (pharma, machinery, wind turbines) welcomes new markets, and Danish consumers might enjoy cheaper South American produce. Agriculture in Denmark is dual-edged: On one hand, Danish agribusiness (especially pork and dairy) is globally competitive and could expand exports of cheese or enzymes to Mercosur. On the other hand, Denmark imports substantial soy and feed from Mercosur – nearly 4% of its extra-EU imports are from Mercosur, primarily soybeans for its intensive pig farms (European Parliament (DG EXPO) study, 2025). Access to cheaper feed inputs is a benefit that could improve margins for Danish farmers. The main competitive concern for Denmark is beef and possibly poultry: Denmark’s beef sector is small, but any EU-wide price dip in meat can affect it. Danish poultry producers might worry about Brazil’s huge poultry industry (though EU quotas limit Brazilian poultry to a fraction of EU consumption) (European Commission factsheet for farmers, Sep 2025). Overall, Denmark tends to favor free trade (being export-oriented), and the government has supported the deal with emphasis on sustainability enforcement. Danish stakeholders often highlight the need for level playing field standards – e.g. ensuring Mercosur adheres to veterinary and environmental rules (no hormones, etc.) so that Danish producers are not unfairly disadvantaged (Thünen Institute update, 2025). In distributional terms, Denmark’s winners include its food processing industry (which might source cheaper inputs) and high-tech exporters; losers could be any farmers facing price competition, though Denmark’s efficient farms and the deal’s safeguards mean impacts are likely minimal (projected output changes ~±1% at most). Indeed, one analysis foresees no Danish sector contracting more than 1.5% (Thünen Institute update, 2025).
• Greece: Greece and similar Southern/Eastern periphery members (with relatively small industrial bases and fragmented agriculture) are likely net losers, or at best marginal participants, in the Mercosur deal. Greece trades little with Mercosur – only ~0.3% of Greek extra-EU exports go to Mercosur, while about 1.6% of its extra-EU imports come from Mercosur (primarily commodities like soy, beef, and tobacco) (European Parliament (DG EXPO) study, 2025). That means Greek exporters gain almost nothing (few new markets), but Greek markets could see import competition in products like beef and possibly citrus or juices (Brazil is a major orange juice exporter, overlapping with Greek oranges). The bigger issue for Greece is its lack of agricultural readiness (see Deliverable B) – Greek agriculture is high-cost and dependent on EU subsidies, thus highly vulnerable to any price downturn. For example, cheaper Mercosur beef or poultry, even in small volumes, could further squeeze Greece’s small livestock farmers. Greece’s enduring problems in CAP fund management (including a recent €392 million fine for subsidy mismanagement) highlight structural weaknesses (To Vima — CAP subsidy mismanagement fine, Jun 2025). These weaknesses limit Greek farmers’ ability to adapt and compete. Regionally, rural Greece (e.g. cattle farmers in Macedonia, smallholders in Thessaly) could face income hits, whereas urban consumers benefit slightly from cheaper imports. The Greek government has echoed France’s concerns and has been among those demanding stronger safeguards. In October 2023, Greece aligned with France, Ireland, and others to delay Mercosur ratification over agriculture and climate worries (TRT World/AFP — “EU countries override France…”, Dec 2025). Bottom line: Greece sees little upside and significant downside risk – a classic case of a distributional loser in a trade deal. This pattern may extend to other Balkan EU members (e.g. Bulgaria, Romania, Croatia), which similarly have small export stakes in Mercosur but large populations of small farmers reliant on EU market prices. These countries are deeply concerned that even a small increase in Mercosur imports (meat, sugar, etc.) could depress EU farm-gate prices and “hollow out” their rural economies.
• Belgium: Belgium encapsulates the internal division the deal causes in parts of Europe. On one side, Belgium’s cosmopolitan, trade-oriented economy (especially Flanders and the port of Antwerp) stands to gain from increased EU-Mercosur trade volumes. Belgian chemical and pharmaceutical industries could expand exports, and as a major logistics hub, Belgium would handle more imports (for instance, more Latin American goods entering via Antwerp). On the other side, Belgian farmers (especially in Wallonia) are vocal opponents of Mercosur. Wallonia has a significant beef cattle sector and already struggled with low prices; an influx of Mercosur beef (even quota-limited) is seen as an existential threat. Belgian dairy farmers similarly worry about competition from Mercosur milk powders or cheeses (though the deal actually favors EU dairy exports). These fears have translated into street protests: young farmers in Belgium blocked highways with tractors in late 2025, decrying the deal as sacrificing EU farming for German cars (TRT World/AFP — “EU countries override France…”, Dec 2025). Politically, Belgium initially hesitated on Mercosur; the Walloon regional parliament famously threatened to veto CETA in 2016, and Mercosur triggers similar sensitivities. Ultimately, in the December 2025 compromise, Belgium agreed to proceed, but only alongside promises of a robust farm safeguard mechanism and EU aid. Thus, in Belgium the winners are abstract (logistics firms, exporters, consumers), while the losers are tangible (family farmers). This has made Belgium a hotbed of debate about trade justice and credible enforcement of environmental and sanitary standards. Expect Belgian policymakers to push hard for the €6.3 billion European farm “crisis fund” and strict monitoring of import surges to placate domestic constituencies (TRT World/AFP — “EU countries override France…”, Dec 2025).
• Balkans (Southeastern EU): EU members in the Balkan region (e.g. Romania, Bulgaria, as well as candidate countries in the Western Balkans) have agricultural profiles that could be strained by Mercosur competition. Romania and Bulgaria, for instance, are significant producers of cereals, sunflower oil, and livestock. While Mercosur is not a direct competitor in wheat or sunflower, it is a powerhouse in maize, poultry, and beef – meaning EU markets for those products could see price pressure. Romanian farmers, already contending with global competition, could see, say, more Brazilian beef pushing down prices or Argentine maize influencing feed markets. Additionally, these countries have structural issues: many small subsistence farms, lower productivity, and instances of misallocation of EU funds (for example, OLAF has uncovered fraud in rural development projects in Romania’s Danube delta) (OLAF — Danube Delta rural development fraud case, Jan 2025). Such issues mean agricultural resilience is low – farmers are less equipped to compete or adjust. The Western Balkans (Serbia, etc.), while not in the EU, also worry about knock-on effects if EU markets saturate with Mercosur imports (since they export some agri-food to the EU). That said, since Balkan member states do not export much to Mercosur (negligible Mercosur trade share) (European Parliament (DG EXPO) study, 2025), they have little to gain from new market access. In EU Council negotiations, countries like Poland, Hungary, Bulgaria, and Romania often sided with France in skepticism of the deal’s benefits, and Poland, for example, voted no due to beef and poultry farmers’ concerns (TRT World/AFP — “EU countries override France…”, Dec 2025). For the Balkan EU members, distributional pressure points include rural employment (agriculture remains a big employer there) and food self-sufficiency worries (see Deliverable C). To avoid being pure losers, these countries will seek EU compensation and strong enforcement of standards to ensure fair competition. Absent that, Mercosur could exacerbate regional disparities, with richer EU countries capitalizing on industrial exports while poorer rural regions in the Balkans bear the adjustment costs.
B. Click to Expand: Current Readiness Gaps – Southern Europe & Balkans
Many southern EU regions fall short on several readiness metrics, despite years of EU investment.
- Productivity varies widely: Northern Italy or northeast Spain are highly productive, but parts of Greece, Portugal, and the Balkan EU states have yields well below the EU average.
- Mechanization is uneven: For example, Greece’s farm machinery fleet is aging and smaller on average, and digital farming uptake is low (few Greek farms use precision ag).
- Logistics and co-ops: Some areas, like Emilia-Romagna in Italy or Catalonia in Spain, boast strong cooperatives and food industries, whereas in Greece, Bulgaria, Romania, many farmers operate in fragmented structures with weaker co-op movements.
These gaps contribute to inefficient marketing and higher costs. Crucially, implementation of the Common Agricultural Policy (CAP) in these regions has exposed serious shortcomings. The European Court of Auditors (ECA) and OLAF have documented numerous investment failures and misallocations of CAP funds:
- In Greece, systemic mismanagement of agricultural subsidies was exposed recently. From 2016–2023, Greece made subsidy payments with “persistent deficiencies” in checks, leading to €392 million of EU funds deemed ineligible (To Vima — CAP subsidy mismanagement fine, Jun 2025). Ghost farmers and inflated land claims (e.g. the “pastureland” scandal) siphoned off money meant for modernization (Steppo EU Law Blog — Greek CAP fraud & EPPO investigations, Mar 2025). Despite warnings, the Greek paying agency (OPEKEPE) failed to implement controls, resulting in what the Commission described as “chronic and structural” issues (To Vima — CAP subsidy mismanagement fine, Jun 2025). Essentially, funds that could have improved competitiveness were lost to fraud and patronage. This highlights a readiness problem: rules exist on paper, but enforcement and effective use of funds lag badly.
- It’s not just Greece: multiple countries have struggled. Italy uncovered even greater CAP fraud volumes – ~€4.65 billion in damages under investigation in 2024 (ten times Greece’s, with stronger prosecution capacity) (Steppo EU Law Blog — Greek CAP fraud & comparative figures, Mar 2025). Romania saw a major OLAF case where rural development funds in the Danube Delta were embezzled, reflecting weak local governance (OLAF — Danube Delta rural development fraud case, Jan 2025). Portugal, while generally better, has also been flagged for a high volume of CAP infractions in some reporting, underscoring that misallocations are not isolated (To Vima — CAP subsidy mismanagement fine, Jun 2025). These examples reveal a pattern: billions intended for farm modernization often fail to reach the right projects. The ECA’s reporting on CAP anti-fraud has stressed fragmented efforts and the need for stronger oversight and control systems (European Court of Auditors — Special Report on CAP fraud response; Systematic literature review on CAP socioeconomic impacts).
- CAP implementation gaps: A recurring theme is limited national administration capacity in parts of Southern/Eastern Europe. From incomplete land registries and weak data systems (including delays and gaps that enabled false claims in Greece) to insufficient on-the-ground inspections, these weaknesses mean that even when money is allocated for equipment, training, or green farming, results can be muted (TRT World — analysis of Greek subsidy scandal, 2025). EU rural development funds have financed tractors, irrigation systems, and other investments, but if projects are selected through cronyism or are not monitored, competitiveness gains remain partial. Mechanization can improve “on paper” without translating into durable productivity increases when funds are misused or maintenance and skills are lacking.
The net effect is that Southern European and Balkan agriculture remains partially “unready” for a competitive shock. Many farms rely on direct payments to stay solvent; if market prices drop due to Mercosur imports, these farms have limited buffer and weak adaptability.
C. Click to Expand: Country Scoring
Overall axis score is the median of the three sub-factor ratings (so one outlier does not dominate).
GermanyAxis 1 — Readiness to absorb competition
1) Production efficiency & structure: High.
Evidence: Germany’s farm structure includes large-scale holdings in the East (average ~186 ha) and mid-scale in the West (average ~55 ha), which supports mechanisation and cost resilience. (Agriculture and rural development)
2) Value-chain coordination: Medium–High.
Evidence: Germany has major farmer-owned processing capacity in dairy via cooperative groups (e.g., DMK), and the Arla–DMK tie-up is explicitly framed as scaling cooperative processing and market reach. (Reuters)
3) Execution capacity: Medium–High.
Evidence: Germany’s CAP payment/control infrastructure relies on integrated farm-level administrative systems (IACS) that enable systematic monitoring and enforcement, and that data infrastructure is widely used in applied research because it is operational at scale. (Agriculture and rural development)
Axis 1 overall: High.
Axis 2 — Concentrated exposure in the sensitive basket
1) Sensitive-sector footprint: Low.
Evidence: The deal’s politically sensitive import risks concentrate on beef, poultry, sugar at EU level, and Germany is not one of the frontline political opponents framed around those sectors in current reporting, while supporters emphasise industrial/export upside. (Reuters)
2) Buffer thinness where it lands: Low–Medium.
Evidence: The same farm structure evidence points to meaningful scale buffers in large parts of German agriculture. (Agriculture and rural development)
3) Mobilisation intensity: Low.
Evidence: Germany is cited as a key supporter, with leadership presenting the deal as a milestone, and it is not described as a protest/veto hotspot in current reporting. (Reuters)
Axis 2 overall: Low.
Final placement: High readiness / Low exposure.
FranceAxis 1 — Readiness to absorb competition
1) Production efficiency & structure: Medium–High.
Evidence: France has large-scale farming on average (~53 ha) and a large professional farming base (~390k farmers), which supports scale and throughput. (Agriculture and rural development)
2) Value-chain coordination: High.
Evidence: French agricultural cooperatives are reported to process ~40% of French agricultural production, which signals strong downstream coordination and bargaining capacity. (ESSEC Knowledge)
3) Execution capacity: Medium.
Evidence: CAP fraud/control performance hinges on national control systems, and EU auditors explicitly treat enforcement quality as a binding variable across member states, with detection and follow-up uneven. (European Court of Auditors)
Axis 1 overall: Medium–High.
Axis 2 — Concentrated exposure in the sensitive basket
1) Sensitive-sector footprint: High.
Evidence: France is a major producer in sensitive categories, including beef/veal within EU production shares and sugar beet among top EU producers, which concentrates perceived exposure to quota-based import pressure. (CEFS)
2) Buffer thinness where it lands: Medium.
Evidence: Exposure concentrates in identifiable rural production systems, and the political salience reflects perceived livelihood risk in those places. (Reuters)
3) Mobilisation intensity: High.
Evidence: Macron is reported calling the agreement “from another era” and stating France will vote against, and France is consistently named among the core opponents. (Reuters)
Axis 2 overall: High.
Final placement: Medium–High readiness / High exposure.
SpainAxis 1 — Readiness to absorb competition
1) Production efficiency & structure: Medium.
Evidence: Spain has deep fragmentation in parts of its farm base, with around half of farms at 5 ha or less, and farm census analysis highlights a large share of low-output small holdings. (Agriculture and rural development)
2) Value-chain coordination: Medium–High.
Evidence: Spain’s cooperative system is large and formalised, with a national organisation representing 3,600+ cooperatives, ~€38bn turnover, and ~1 million members, which supports marketing, processing, and bargaining. (Cooperativas Agro-alimentarias)
3) Execution capacity: Medium.
Evidence: CAP outcomes depend on national administrative controls, and the EU audit view treats implementation quality as decisive for whether funds translate into modernisation. (European Court of Auditors)
Axis 1 overall: Medium.
Axis 2 — Concentrated exposure in the sensitive basket
1) Sensitive-sector footprint: Medium.
Evidence: Spain’s sensitive exposure is meaningful in specific products and regions, with rice production heavily concentrated (Guadalquivir marshes produce over half of Spanish rice in the cited analysis), which creates place-based risk even if national aggregates dilute it. (MDPI)
2) Buffer thinness where it lands: Medium.
Evidence: Fragmented holdings raise thin-margin sensitivity in affected regions. (Agriculture and rural development)
3) Mobilisation intensity: Low–Medium.
Evidence: Spain is repeatedly listed among supporters, and current reporting frames opposition around France/Poland/Hungary more than Spain. (Reuters)
Axis 2 overall: Medium.
Final placement: Medium readiness / Medium exposure.
PortugalAxis 1 — Readiness to absorb competition
1) Production efficiency & structure: Low–Medium.
Evidence: Portugal’s farm base is highly fragmented, with ~67% of farms under 5 ha and ~46% under 2 ha, and the same official summary notes an aging and low-skilled demographic profile, which constrains mechanisation and upgrading pace. (Agriculture and rural development)
2) Value-chain coordination: Medium–Low.
Evidence: The official profile shows a small primary sector share of the economy alongside very fragmented farm structure, which typically weakens bargaining power unless counterweighted by strong co-op/processing, and that counterweight is not evidenced in the same profile. (Agriculture and rural development)
3) Execution capacity: Medium.
Evidence: EU auditors flag that CAP effectiveness depends on national control capacity and follow-through, and this is a known differentiator across member states. (European Court of Auditors)
Axis 1 overall: Medium–Low.
Axis 2 — Concentrated exposure in the sensitive basket
1) Sensitive-sector footprint: Medium.
Evidence: The Portugal profile frames a large, place-embedded small-farm base, which raises sensitivity to any category where imports pressure farmgate prices, even if the exact mix (beef/poultry/rice/sugar) varies by region. (Agriculture and rural development)
2) Buffer thinness where it lands: High.
Evidence: Fragmentation plus aging and low skills are direct thin-buffer signals. (Agriculture and rural development)
3) Mobilisation intensity: Low–Medium.
Evidence: Portugal is not named as a core veto/opposition leader in current Reuters summaries that emphasise France/Poland/Hungary and farmer protests elsewhere. (Reuters)
Axis 2 overall: Medium.
Final placement: Medium–Low readiness / Medium exposure.
DenmarkAxis 1 — Readiness to absorb competition
1) Production efficiency & structure: High.
Evidence: Denmark is described as having the highest average farm size in the EU (~75 ha) in the CAP strategic plan summary. (Agriculture and rural development)
2) Value-chain coordination: High.
Evidence: Denmark’s flagship agri-food value chains run through farmer-owned cooperatives and processors, and Arla describes itself as farmer-owned while Danish Crown states it is owned via a cooperative society structure. (Arla)
3) Execution capacity: Medium–High.
Evidence: Danish food-chain enforcement is described as operating under strict veterinary controls at farms and abattoirs, which signals strong compliance throughput in practice. (Danish Crown)
Axis 1 overall: High.
Axis 2 — Concentrated exposure in the sensitive basket
1) Sensitive-sector footprint: Low–Medium.
Evidence: Denmark’s core livestock model is heavily oriented to pork/dairy systems rather than the EU’s highest-salience Mercosur flashpoints highlighted in Reuters coverage (beef, sugar, poultry). (Reuters)
2) Buffer thinness where it lands: Low.
Evidence: Large average farm size is a buffer indicator. (Agriculture and rural development)
3) Mobilisation intensity: Low.
Evidence: Denmark is not reported as a leading veto-threat country, and it held the rotating presidency managing the process rather than opposing it. (Reuters)
Axis 2 overall: Low–Medium.
Final placement: High readiness / Low–Medium exposure.
GreeceAxis 1 — Readiness to absorb competition
1) Production efficiency & structure: Low.
Evidence: Greece’s official CAP profile gives an average farm size of ~5.8 ha, and reporting on Greek agriculture stresses high fragmentation, aging farmers, and low mechanisation/scale constraints. (farm-europe.eu)
2) Value-chain coordination: Low.
Evidence: The EEA review explicitly describes Greek primary production as fragmented and points to weak cooperative/value-chain organisation as a recurring constraint. (cooperativas-agro.s3.eu-west-1.amazonaws.com)
3) Execution capacity: Low.
Evidence: Reuters reports a €392m correction tied to persistent deficiencies in subsidy checks, and EPPO communications describe investigations linked to the paying agency (OPEKEPE) around CAP-linked fraud dynamics. (Publications Office of the EU)
Axis 1 overall: Low.
Axis 2 — Concentrated exposure in the sensitive basket
1) Sensitive-sector footprint: Medium.
Evidence: The exposure mechanism is less “big national volumes” and more “thin-margin local systems,” and Greece’s farm structure is dominated by small holdings, which amplifies sensitivity to any price pressure in meat/similar baskets. (farm-europe.eu)
2) Buffer thinness where it lands: High.
Evidence: Very small average holding size and weak modernisation signals are direct thin-buffer indicators. (farm-europe.eu)
3) Mobilisation intensity: Medium.
Evidence: Greece appears in current coverage as part of the protest geography around the deal, even if it is not the headline veto leader. (The Guardian)
Axis 2 overall: Medium–High.
Final placement: Low readiness / Medium–High exposure.
BelgiumAxis 1 — Readiness to absorb competition
1) Production efficiency & structure: Medium.
Evidence: Flanders’ CAP profile shows an average farm size of ~27 ha and very intensive livestock systems, which implies capability in high-throughput farming, with regional asymmetry inside Belgium. (Agriculture and rural development)
2) Value-chain coordination: Medium.
Evidence: Belgium’s exposure is explicitly described as internally divided between trade/logistics strengths and farm vulnerability, and the distribution of livestock-intensive systems in Flanders is well documented in the CAP profile. (Agriculture and rural development)
3) Execution capacity: Medium.
Evidence: EU auditors treat CAP control performance as system-dependent at national level, and Belgium is not flagged in the same way as Greece/Romania in the sources used here. (European Court of Auditors)
Axis 1 overall: Medium.
Axis 2 — Concentrated exposure in the sensitive basket
1) Sensitive-sector footprint: High.
Evidence: Flanders alone reports ~4.5m pigs and ~6,000 poultry farms with ~5m poultry, and Belgium’s farm politics are strongly tied to livestock and price pressure narratives. (Agriculture and rural development)
2) Buffer thinness where it lands: Medium.
Evidence: The Belgian debate is framed as concentrated pain for farmers versus diffuse gains for exporters/logistics, which is a classic “thin-buffer, high-salience” pattern even in a richer member state. (The Guardian)
3) Mobilisation intensity: High.
Evidence: Reuters reports Belgian farmer protests against Mercosur turning violent, with police using tear gas and water cannon. (Reuters)
Axis 2 overall: High.
Final placement: Medium readiness / High exposure.
RomaniaAxis 1 — Readiness to absorb competition
1) Production efficiency & structure: Low.
Evidence: Romania is described as having ~3.5 million farmers, with structural weaknesses including limited irrigation and low education, and research summarises that the overwhelming majority of farms are under 5 ha. (Reuters)
2) Value-chain coordination: Low.
Evidence: The Romania CAP profile emphasises many small farmers and weak human-capital/irrigation constraints, which typically correlates with low bargaining power and weak processing integration outside a few large players. (Reuters)
3) Execution capacity: Low–Medium.
Evidence: OLAF public reporting covers rural development fund fraud cases in Romania, indicating governance and control vulnerabilities in CAP-linked spending environments. (European Commission)
Axis 1 overall: Low.
Axis 2 — Concentrated exposure in the sensitive basket
1) Sensitive-sector footprint: Medium.
Evidence: Reuters highlights the sensitive Mercosur flashpoints as beef/sugar/poultry, and Romania’s exposure is plausibly indirect through EU-wide price formation plus domestic rural dependence rather than being the headline national producer like France. (Reuters)
2) Buffer thinness where it lands: High.
Evidence: Romania is cited as having ~23% of its labour force in agriculture and very high elderly share, which makes adjustment shocks place-concentrated and politically fragile. (Reuters)
3) Mobilisation intensity: Medium.
Evidence: The mobilisation pattern is visible across Europe, and Romania’s structural dependence creates the conditions for escalation even when it is not the headline veto leader in Reuters narratives. (Reuters)
Axis 2 overall: Medium–High.
Final placement: Low readiness / Medium–High exposure.
BulgariaAxis 1 — Readiness to absorb competition
1) Production efficiency & structure: Low–Medium.
Evidence: Bulgaria’s CAP profile reports ~132,742 agricultural holdings and a rural population footprint, and specialist literature describes major structural transformation alongside persistent duality challenges. (Agriculture and rural development)
2) Value-chain coordination: Medium–Low.
Evidence: The same structure signals many holdings, which typically weakens bargaining power unless strongly coordinated, and the evidence base here does not show a Spain/Denmark-style cooperative backbone. (Agriculture and rural development)
3) Execution capacity: Medium.
Evidence: The Commission’s CAP governance logic treats modernisation success as dependent on administrative design and implementation, and EU auditors stress that fraud-control effectiveness varies with national systems. (Agriculture and rural development)
Axis 1 overall: Medium–Low.
Axis 2 — Concentrated exposure in the sensitive basket
1) Sensitive-sector footprint: Medium.
Evidence: The sensitive categories stressed in current EU political debate are beef/sugar/poultry, and Bulgaria’s core vulnerability is better evidenced through rural structure and buffers than through being named as the lead producer. (Reuters)
2) Buffer thinness where it lands: High.
Evidence: Rural areas account for a meaningful share of territory and population, and structural transformation literature stresses ongoing adjustment sensitivity. (Agriculture and rural development)
3) Mobilisation intensity: Medium.
Evidence: The deal’s mobilisation geography is explicitly pan-European in current reporting, and Bulgaria fits the “thin-buffer rural” profile that tends to politicise price shocks quickly. (Reuters)
Axis 2 overall: Medium–High.
Final placement: Medium–Low readiness / Medium–High exposure.
One-line axis outputs for the 2×2
- Germany: Axis 1 High, Axis 2 Low
- Denmark: Axis 1 High, Axis 2 Low–Medium
- Spain: Axis 1 Medium, Axis 2 Medium
- France: Axis 1 Medium–High, Axis 2 High
- Belgium: Axis 1 Medium, Axis 2 High
- Portugal: Axis 1 Medium–Low, Axis 2 Medium
- Greece: Axis 1 Low, Axis 2 Medium–High
- Romania: Axis 1 Low, Axis 2 Medium–High
- Bulgaria: Axis 1 Medium–Low, Axis 2 Medium–High
D. Click to Expand: Numeric rules and values to recreate the plot
Numeric rules1) Rating → number (0 to 1 scale)
We used anchor points plus a few “leaning” midpoints:
- Low = 0.20
- Low–Medium (lean Low) = 0.30
- Medium–Low (lean Medium) = 0.40
- Medium = 0.55
- Medium–High (lean Medium) = 0.70
- Medium–High (lean High) = 0.75
- High = 0.85
2) Axis aggregation rule
For each axis, we set the final axis score as the median of the three factor numbers:
- Axis score = median(factor1, factor2, factor3)
(so one extreme doesn’t dominate the placement)
Those two axis scores are the x,y coordinates used in the plotted 2×2.
Country,A1_Prod,A1_ValueChain,A1_Exec,A1_AxisScore,A2_Footprint,A2_BufferThinness,A2_Mobilization,A2_AxisScore,X,Y
Germany,0.85,0.85,0.75,0.85,0.20,0.30,0.20,0.20,0.85,0.20
Denmark,0.85,0.85,0.75,0.85,0.30,0.20,0.30,0.30,0.85,0.30
Spain,0.55,0.70,0.55,0.55,0.55,0.55,0.40,0.55,0.55,0.55
France,0.70,0.85,0.55,0.70,0.85,0.55,0.85,0.85,0.70,0.85
Belgium,0.55,0.55,0.70,0.55,0.85,0.55,0.85,0.85,0.55,0.85
Portugal,0.40,0.40,0.55,0.40,0.55,0.85,0.40,0.55,0.40,0.55
Greece,0.20,0.20,0.20,0.20,0.55,0.85,0.75,0.75,0.20,0.75
Romania,0.20,0.20,0.30,0.20,0.55,0.85,0.75,0.75,0.20,0.75
Bulgaria,0.40,0.40,0.55,0.40,0.55,0.85,0.75,0.75,0.40,0.75
The EU–Mercosur debate can feel emotionally and politically intense even when the EU-wide macro number looks small. The mechanism is concentration, and concentration works in three layers.
- The agreement itself signals which farm categories are politically sensitive, because it builds speed limits into market opening for those products.
- A cumulative lens treats Mercosur as one deal inside a broader portfolio of trade openings, and repeated exposure changes how “manageable” feels over time.
- When pressure lands in regions with thin buffers, even modest price movement can translate into livelihood stress, local anger, and fast mobilisation.
Let's deep-dive into each of the three aforementioned layers
1. Quotas and phase-ins are the deal’s built-in shock absorbers
The agreement uses two tools to manage sensitivity in specific agricultural products, tariff-rate quotas (TRQs) and phase-ins. These tools matter because they shape the pace and the scale of competition, which is often what determines whether politics stays calm or escalates.
- A tarif-rate-quota (TRQ) splits imports into two channels, a limited volume can enter under a lower tariff, and volumes above that face a higher tariff. The quota becomes a cap on “cheap access,” which slows down sudden surges.
- A phase-in spreads liberalisation across time. Market opening arrives as a ramp rather than a step, which gives producers and institutions more runway to adapt.
Why this is a political signal
When the Commission highlights TRQs and staged exposure for beef, poultry, rice, ethanol, and sugar, it is effectively flagging the products where it expects the highest salience. The design choice itself is a clue about where the EU thinks pressure could concentrate. (Commission agriculture factsheet)
These instruments do not eliminate pressure. They manage the speed and ceiling of the most visible pressure points, and that often determines whether adjustment is orderly or destabilizing.
2. The cumulative lens changes the question from “one deal” to “portfolio pressure”
The second layer is where many readers get lost, because “cumulative impact” sounds academic. It is simple in practice.
A cumulative view asks:
How much pressure is building on the same farm categories across multiple trade agreements over time, rather than treating each agreement as an isolated event?
Why the portfolio framing matters politically
For many rural producers, the lived experience is not a single shock with a clean recovery. It is repeated rounds of competition, with each round affecting investment decisions, debt, margins, and expectations. Even when each agreement looks manageable in isolation, repeated exposure can still produce long-run strain, and that strain becomes a credibility issue.
What the JRC is doing here
The JRC analysis focuses on vulnerability across the portfolio and highlights beef, sheep/goat, poultry, rice, and sugar as sectors that tend to appear as vulnerable when trade agreements are assessed cumulatively. (JRC — cumulative impact report)
These are the categories where pressure tends to recur, and where the political system ends up revisiting the same legitimacy question again and again.
3. Concentration turns incremental economics into high-intensity local politics
The final layer explains the emotional temperature.
EU-level averages smooth out local concentration
A large economy can show a modest average effect while still producing pockets of intense disruption. Politics forms in those pockets, because that is where livelihoods and identity narratives are most visible.
What “thin buffers” means in practice
Thin buffers are the conditions that convert small price pressure into fast stress. They commonly include:
- Fragmented holdings and limited scale, which raises unit costs and reduces flexibility. This is a structural feature in parts of European farming, Eurostat’s farm structure statistics show that a large share of EU farms are very small, with a majority under 5 hectares. (Eurostat statistics- Farms and farmland in the European Union )
- Thin margins and cash-flow fragility, which makes even modest price pressure feel existential. A key reason margins can be fragile is that a meaningful share of farm income is already “filled in” by public support, the European Court of Auditors notes that direct payments form a stable element of farmers’ income and act as a buffer, and it reports the Commission estimate that this additional income represents around 26% of farmers’ income. (European Court of Auditors). When that buffer is psychologically and financially baked into viability, even limited market pressure can trigger “this threatens the model” reactions.
- Weak bargaining power in the value chain, which pushes adjustment burdens onto producers. The OECD literature reviews evidence that downstream segments are typically more concentrated than farm-level production, which is the basic setup that weakens farmer bargaining power in price formation (OECD). The EU’s own policy agenda on unfair trading practices is built around the same diagnosis, that farmers are often the weaker party in the agri-food supply chain and need protection from practices by stronger buyers (European Council of the European Union).
- Limited processing, storage, and logistics, which reduces value capture and resilience. When regions lack downstream capacity, they have fewer levers to shift from commodity competition to value competition, so price pressure translates more directly into income pressure.
- Fewer alternative jobs locally, which turns “adjustment” into “decline” in the public narrative. This is the political economy channel, when exit options are scarce, farmers and rural workers interpret competition as a community-level threat, which raises mobilization intensity and creates veto politics.
Putting it together, the politics become predictable. Quotas and phase-ins can keep the EU-level shock modest, and they can still leave very visible local stress where vulnerable sectors overlap with thin-buffer regions, because the agreement’s “sensitive basket” maps onto real places with real employment identities.
Why rural politics escalates quickly
When pressure lands in these conditions, the adjustment story becomes personal and place-based. The sector feels like a livelihood anchor in a specific region, and it also carries symbolic weight nationally, because food production and rural life connect to fairness, dignity, and recognition.
In a region with strong coordination, modern logistics, and viable upgrading paths, competition can feel like a push toward higher value and reallocation. In a region with fragmented production and weak buffers, the same competition can feel like margin compression, anxiety, and a threat to local continuity.
The dispute lives in assumptions and enforcement credibility, and it persists because trade outcomes depend on transition realism. Change the adjustment story, change how binding quotas become in practice, and change whether you treat the deal as a single shock or part of a trade portfolio, and conclusions shift.
Three forks that change the political risk map:
- Adjustment realism: smooth reallocation in models versus friction in real towns.
- Quota dynamics: binding quotas versus partial utilisation versus strategic timing.
- Cumulative exposure: Mercosur alone versus cumulative pressure across the wider trade agenda. (JRC — cumulative lens)
Europe can capture modest macro gains, and Europe can still face high-intensity backlash, because the distribution pattern determines legitimacy.
🔽 Click to Expand: Expert Disagreements & Debates
The EU–Mercosur accord has ignited sharp debate among experts, stakeholders, and policymakers, often splitting into pro-growth vs. anti-displacement camps with underlying differences in values and trust:
• Growth vs. Displacement:
Proponents (including the European Commission, many economists, and export industry groups) argue the deal is a win-win bringing overall growth, more jobs, and consumer benefits.
They emphasize the modest positive-sum gain in GDP/welfare (European Parliament (DG EXPO) study, 2025; Sustainability Impact Assessment (LSE), 2020) and strategic advantages (like diversifying trade away from China) (OeNB Bulletin Q4/25, 2025; Thünen Institute update, 2025). Opponents (farm unions, environmental NGOs, some academics) counter that these macro gains are insignificant or illusory and come at the cost of painful sectoral displacement, arguing the headline +0.1% GDP does not reflect the social costs of job losses in rural areas or the difficulty of repurposing displaced farm labor (Austrian Chamber of Labour (AK Wien), 2021; Sustainability Impact Assessment (LSE), 2020).
For instance, Austrian analysts called the CGE gains “small and not validated,” warning of implausible trade patterns (large EU export surges vs. Mercosur) and possible overstatement of benefits (Austrian Chamber of Labour (AK Wien), 2021). This empirical debate boils down to whether one trusts the model predictions and believes the EU can smoothly compensate losers.
• Environmental & Standards Enforcement: There is broad disagreement over credibility in this area.
The Commission insists the deal “will not cause deforestation” and points to new sustainability provisions (TSD chapter, Paris Agreement language, and parallel EU instruments such as deforestation-related measures) as safeguards (European Parliament (DG EXPO) study, 2025; European Parliament Legislative Train – state of play). They also stress that imports must comply with EU SPS and food-safety rules (including bans on hormone-treated beef) (European Commission factsheet for farmers, Sep 2025; Thünen Institute update, 2025).
Critics argue the sustainability clauses amount to “empty promises,” and emphasize the absence (or weakness) of enforceable sanctions for environmental breaches (OeNB Bulletin Q4/25, 2025; European Parliament Legislative Train – state of play). They argue the pact could exacerbate deforestation by expanding beef and soy production.
A 2023 study prepared by Institut de l’Élevage for the Greens/EFA group estimated that, in worst-case scenarios, the beef quota could be associated with 620,000 to 1.35 million hectares of additional Amazon deforestation over five years (Greens/EFA – Institut de l’Élevage study, 2023). This value-based clash pits those prioritizing climate and biodiversity against those emphasizing engagement and enforcement through trade, arguing that closer EU alignment is preferable to Mercosur drifting toward alternative partners (OeNB Bulletin Q4/25, 2025; European Parliament (DG EXPO) study, 2025).
• Credibility & Trust: Doubts persist over whether Mercosur governments will honor commitments and whether the EU will deploy safeguards quickly enough.
Farmers and NGOs point to prior rollbacks and enforcement limits in the Amazon as reasons for skepticism about deforestation and labor-rights implementation (Greens/EFA – Institut de l’Élevage study, 2023). The EU’s “joint instrument” on deforestation has not fully reassured critics, who argue it lacks hard sanctions (European Parliament Legislative Train – state of play). Farmers also question whether the Commission would actually trigger bilateral safeguards if import surges “threaten” injury, or whether political delay would dominate until after damage is done (European Parliament (DG EXPO) study, 2025).
This credibility gap helps explain demands for firmer guarantees, including France’s push for an “emergency brake” and stricter pesticide-related assurances (TRT World/AFP – Macron statement, Jan 8 2026). On the other side, proponents argue that prior EU trade deals did not collapse EU agriculture, and note that quotas can be under-filled due to market conditions.
The Thünen Institute’s 2025 update, for example, finds no EU sector would shrink by more than 1.5% under Mercosur and highlights quota underutilization dynamics (Thünen Institute update, 2025). Detractors, meanwhile, point to “trade bias” and cumulative-agreement risk, citing earlier JRC-linked discussions warning of potentially serious hits to beef and poultry under multiple FTAs (Friends of Europe, 2018; European Parliament Legislative Train – state of play).
In summary, expert disagreement arises from differing empirical interpretations (model optimism vs. historical skepticism), value differences (economic liberalism vs. precautionary protection of farming and environment), and credibility judgments (trust in Mercosur and EU institutions to implement safeguards). The “growth vs. displacement” debate is not just about numbers but what Europe values more: a slight GDP uptick and geopolitical link, or safeguarding environmental commitments and the rural fabric.
The compromise emerging — with added safeguards, funds, and monitoring — seeks to narrow these divides, but the narrative gap remains large.
Europe’s trade strategy increasingly functions as foreign policy, because the Single Market is an instrument that moves faster than rebuilding industrial depth. The deeper constraint is that every external opening still arrives inside real places, and real places decide whether Europe’s strategy feels legitimate.
EU–Mercosur therefore becomes a stress test for a familiar European problem, uneven readiness across the Union. Some regions can translate pressure into upgrading, others translate it into backlash risk, and that divergence accumulates politically even when the EU-level number stays modest.
The agreement is not only a choice about partners in Latin America, it is a choice about Europe’s internal tempo. It reveals whether Europe can move outward while keeping enough institutional speed and local buffer capacity to prevent concentrated adjustment from hardening into a grievance identity.
The same questions that puzzled many during the European Sovereign Crisis, are still unanswered and very relevant:
- What kind of Union emerges when readiness differences become the main predictor of political stability under competitive shocks?
- Which Europe is being optimized for when “small average gains” are treated as sufficient justification?
- How much legitimacy can be spent in thin-buffer regions before Europe’s ability to act externally begins to shrink?
KEY REFERENCES🔗
• Reuters (Jan 9, 2026) — member states approve moving to signature
• Reuters (Jan 9, 2026) — signing planned for Jan 17 in Paraguay
• European Commission — agreement text and process notes
• European Commission — agriculture TRQ factsheet (PDF)
• SIA (LSE Consulting) — final report (PDF)
• JRC (2021) — cumulative impact on EU agriculture (PDF)
• Financial Times (Jan 9, 2026) — member states back the deal
• The Guardian (Jan 9, 2026) — EU states back controversial deal
• EconScope — Europe’s Hollowing-Out Moment